 Chat with AGB Board Bot
Opinions expressed in AGB blogs are those of the authors and not necessarily those of the institutions that employ them or of AGB.
Among the differing goals and objectives laid out by colleges and universities for their endowments, one that is universally shared is intergenerational equity, or the concept that endowed institutions should provide the same level of support to future generations as they do to the present generation. In practical terms, it’s a matter of spending at a rate that doesn’t exceed an institution’s compound return after accounting for inflation.
“Inflation” is a word that has been ubiquitous in recent years. After a somnolent decade-plus, inflation awoke with a vengeance as one way among many that the COVID-19 crisis extracted its measure of pain. At the peak of the most recent inflationary outbreak in calendar year 2022, the Consumer Price Index (CPI) rose to an annual rate of 8 percent, the highest in 40 years. One gauge of the impact: just two years earlier, in 2020, CPI increased at an annual rate of 1.2 percent.
Those responsible for the endowments of higher education institutions are all too familiar with inflation. They live with it every year and take it into account in policy decisions ranging from asset allocation to spending rates. Many institutions use it as the basis for setting long-term return objectives. While many target a nominal rate of return, many others target a rate of return plus CPI or HEPI (the Higher Education Price Index, a measure specifically geared to the unique spending and purchasing patterns of colleges and universities).
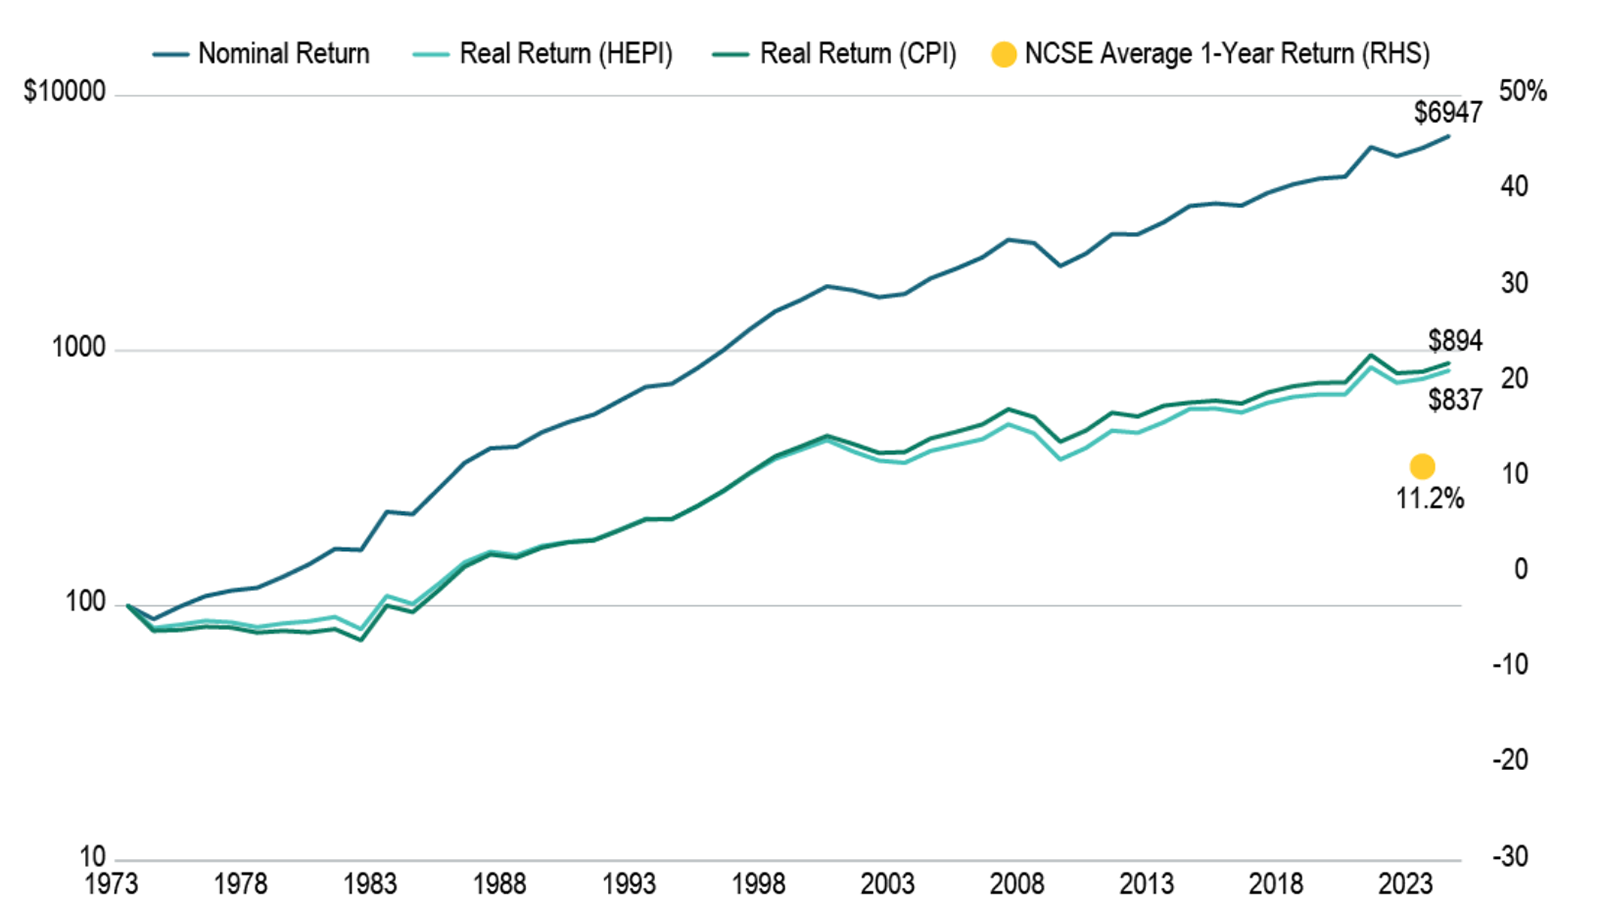
Taking our cue from the most recent inflationary outbreak and the recently released NACUBO-Commonfund Study of Endowments, we turned our attention to the cumulative effect of inflation on the investment returns reported by participating institutions since the inception of the endowment study for fiscal year (FY) 1974 (with FY73 = 100 as the starting point). The graph that accompanies this narrative traces nominal returns for this 51-year period as well as real, after-inflation returns once CPI or HEPI is factored in.
The Path of a $100 Million Endowment in 1973
Based on actual reported returns compounded over this period, without accounting for inflation, a $100 million endowment in FY74 would have grown to $6.95 billion on June 30, 2024. Discounting returns using HEPI as the measure of inflation over the same period, that $100 million would have grown to only $837.1 million. Using CPI as the deflator, the comparable net figure is $894.8 million.
In any given fiscal year, the difference between the rate of inflation as measured by HEPI and CPI can be quite wide. For example, in FY03, HEPI was 5.1 percent and CPI was 2.2 percent. In other years, such as FY24, they are quite close: HEPI, 3.4 percent; CPI 3.3 percent. For the majority of years, HEPI has exceeded CPI.
In the graph, HEPI and CPI seem to track reasonably close to each other. In fact, on an average annual basis, the difference is only about $1 million, or an average annual increase over the full period of 4.38 percent for HEPI and 4.21 percent for CPI. But that adds up to a cumulative difference of $57.7 million—a considerable sum when viewed from the perspective of perpetual institutions. The reason is that the two measure inflation very differently.
click image to enlarge
CPI versus HEPI
CPI is a weighted average of prices for a basket of goods and services purchased by U.S. consumers, such as housing, transportation, food and beverages, apparel, recreation, medical care, and others. Housing (including rents and homeowners’ rent equivalent) is by far the largest component (recently about 45 percent), and it has become increasingly important as it accounts for a larger share of consumers’ spending than it has in the past. The U.S. Bureau of Labor Statistics gathers, calculates, and publishes prices, both inflationary and deflationary, on a monthly basis.
Consumers’ purchases are much different from the purchases of educational institutions. HEPI measures the average relative level in the price of a fixed market basket of goods and services purchased by colleges and universities each year through current educational and general expenditures, excluding research. HEPI is used primarily to project future budget increases required to preserve purchasing power. Eight main components contribute to the HEPI regression calculation: faculty salaries, administrative salaries, clerical costs, service employee costs, fringe benefits, miscellaneous services, supplies and materials, and utilities. HEPI has been calculated annually since 1961. In 2005, Commonfund Institute assumed responsibility for the index and the proprietary model used to calculate its values.
Returning to the original point, by whichever means inflation is measured, it has a corrosive effect on endowments. Investment returns vary from year to year, usually to the upside but not without regressions into negative territory. Inflation fluctuates as well—but it is a constant headwind that makes a hard task harder. In the current environment, it is critical that governing boards, investment committees, and others charged with overseeing endowed funds ensure that they duly account for inflation when they are setting strategic policy and making asset allocation and spending rate decisions.
With Thanks to AGB Sponsor: Commonfund
![]()
RELATED RESOURCES


Reports and Statements
Collaborative Leadership for Higher Education Business Model Vitality