 Chat with AGB Board Bot
- Board members frequently are not involved in the development, design, and monitoring of student success metrics. They should be involved in such activities because ensuring student success, and monitoring it, is part of their governance obligations.
- Three major sets of student success metrics relate to (1) progression, retention, and graduation; (2) postgraduation outcomes, by program, including a livable wage, wage premium, and manageable debt; and (3) disaggregating these two sets of metrics to discern whether there is equity in terms of student success among various groups on campus.
- Considerable debate surrounds the issue of how best to measure student success in terms of postgraduation outcomes and growing pressure to do so, by consumers, states, and the federal government.
- Individual student success metrics should not be considered in isolation. Frequently one metric will influence the ability to achieve others, and sub-metrics will roll up and relate to the ability to achieve bottom-line metrics such as graduation rates.
- Some findings on the utility of different metrics and how best to implement them, such as initiatives by Georgia State University, AGB and others, are readily available, are broadly applicable to most institutions, and can help individual institutions avoid having to reinvent the student success metrics wheel.
When it comes to student success metrics, board members regularly hear a litany of benchmark numbers—graduation rates and metrics related to retention, progression, completion, postgraduation labor market outcomes—but the challenge is often to determine which numbers really matter and why. Higher education leaders say many board members are allowing creation, tracking, and analysis of student success benchmarking metrics to occur without a full understanding of their significance for the institutions, adding that they do so at the risk of failing to fulfill their governance mandates.
Fresh evidence comes from an ongoing initiative by AGB, the John N. Gardner Institute for Excellence in Undergraduate Education, the Kentucky Council on Postsecondary Education (CPE), and eight higher education institutions in Kentucky. The aim is to examine student success metrics, with a particular eye to creating student success benchmarks related to equity and best practices for board members in this area.
Research to date suggests that many institutions and board members have their work cut out for them, says Drew Koch, chief executive officer of the Gardner Institute. “Boards are a vital player in the realm of student success, but they’re often not involved in that at all because they haven’t been asked or [metrics] haven’t been necessarily developed in ways that would help them help the institution,” Koch says.
Student success metrics matter because they are increasingly tying into federal, state, and parental payer evaluations of institutions. Even if they weren’t, these metrics are an invaluable tool for pinpointing strengths, weaknesses, opportunities, and threats at higher education institutions. As the demographic cliff approaches, such tools will be critical to help institutions design and achieve their strategic plans.
But picking and employing student success metrics requires knowing how such numbers work together and do or do not help lead to actionable outcomes over time.
The Good, the Bad, and the Ugly of Student Success Metrics
Boards should consider several key categories of student success metrics, says Josh Wyner, executive director of the College Excellence Program at the Aspen Institute. Wyner has studied and worked with boards over the past decade.
One category of metrics relates to whether students succeed in college, he notes. Typically, boards examine metrics related to whether and how many students are enrolled, retained, and graduate. Increasingly, boards are also looking at metrics related to whether and how quickly students progress in an academic program, including when they declare majors, how many credits are achieved by different points in time, when they complete critical program-related courses, and how long it takes them to graduate.
A second important category of metrics relates to postgraduation outcomes, including whether students succeed in jobs or in further higher education, Wyner says. Boards are examining how much students earn at different times after graduation, whether they are earning a livable wage that is more than they would have earned without a college degree, and how much debt they owe. Because many students continue on in college before entering the labor market—students with bachelor’s degrees going on to graduate school and those with associate degrees going on to four-year colleges—Wyner believes it is important for boards to look at how many students continue in higher education and, among those who do, how many earn a subsequent degree.
A final area of inquiry for boards relates to equitable levels of student success, which are revealed by metrics that are disaggregated by student characteristics. How well are different groups at higher education institutions doing while they are students and after graduation? Are certain groups clustered in programs with lower postgraduation income? How do transfer students progress relative to those who began at an institution in the first year? Are all students engaged in the same educational opportunities while at college, such as internships, research assistantships with professors, and leadership roles in student organizations?
In the multitude of student success metrics, experts say that there are some commonalities as to what makes good metrics good and bad metrics bad.
“I think at a high level good metrics are strategic: they’re tightly aligned to the core values of the institution; they’re achievable yet ambitious; they’re highly relevant to the day-to-day work in the campus community; and they’re always actionable,” says Jeff Gold, who until recently served as assistant vice chancellor for student success at the 500,000-student California State University (CSU), where he led the development of a graduation metric that contributed to a doubling of four-year graduation rates over the past eight years.1
According to Gold, who now leads a data visualization business, institutions must be mindful to set the right metrics. “Poorly designed metrics often lead higher education leaders and trustees to miss the forest for the trees, and to focus on things that really aren’t of paramount importance with respect to advancing student success and equity,” he says.
Boards need to focus on a smaller number of key metrics, says Marjorie Hass, president of the Council of Independent Colleges (CIC) and former president of Rhodes College. “I do think it’s really important to work with your board to develop a set of metrics that they look at over time,” Hass says. “Ideally, it flows from your strategic plan and your strategic thinking, but you’ve got to try to narrow metrics down to a small set.”
Axiomatic Fundamentals
Some student success findings are so fundamental—the equivalent of student success tent poles—that board members would be remiss to not understand them.
One is the primacy of the bachelor’s degree. Anthony Carnevale, director of the Georgetown University Center on Education and the Workforce, has found that the bachelor’s degree remains the most critical higher education offering for delivering career earnings. This fact translates into the rightful primacy of tracking success in delivering attainment of bachelor’s degrees. Thus, while some graduate and professional degrees may be more lucrative to higher education institutions and while associate degrees and certificate programs are also important, it is often helpful for institutions to focus attention on bachelor’s degree attainment, including the alignment of shorter programs with degree attainment.2
“If you have a bachelor’s degree, you are healthier, your family is less is likely to break up, [and] you also contribute more to state and local taxes—there are many positive outcomes,” says Carnevale, adding that his research suggests the primacy of the bachelor’s degree will continue into the future.
Another critical research finding relates to program of study. Carnevale’s research demonstrates that students with technical degrees tend to have greater earnings success and satisfaction than students in other degree programs, even if the students in non-technical programs receive their degrees from more prestigious higher education institutions. This finding unfolds into a variety of implications for related metrics, as discussed below.3
State Metrics of Success
Many states are establishing key metrics of success. In 2019, the Louisiana Board of Regents approved a master plan called “Louisiana Prospers” that established an educational attainment goal of 60 percent of the state’s working adult population having a degree or credential of value by 2030.4
“We’re very focused on making sure that we’re addressing the education to employment pipeline and moving people to prosperity in a state that has pretty significant poverty rates,” says Louisiana Commissioner of Higher Education Kim Hunter Reed. Education attainment has increased from 44 percent of Louisiana’s working adults holding a degree or credential of value in 2019 to 49.5 percent in September 2023, Reed says.5
“Our strategic plan adopted in 2019 recognized credentials, not just degrees,” Reed says. “We tried to make sure that we were talking about honoring all pathways, including associate’s degrees as well as bachelor’s degrees and industry-based certificates. We want to make sure we’re enlisting our community and technical colleges, along with our four-year institutions, in terms of talent development.”
Metrics of higher education attainment also have been expanded to include more groups in Louisiana, including not only traditional K–12 high school graduates, but also foster youth, single parents, veterans, formerly incarcerated individuals, and people from rural communities, Reed says.
A Metrics Poster Child
Georgia State University has had remarkable success in increasing graduation rates. A public institution serving predominantly minority and low-income students, its graduation rate has risen more than 70 percent since 2008. It now disseminates its model and assists other institutions through its National Institute for Student Success (NISS) (https://niss.gsu.edu), which has consulted with more than 70 other higher education institutions.
One driver of Georgia State’s graduation rate progress was, early on, crunching the numbers and determining which sub-metrics could help measure progress, says Tim Renick, a Georgia State professor who founded and serves as executive director of NISS. He says his work at NISS has demonstrated that the efficacy of the metrics that worked at Georgia State is remarkably consistent across many different higher education institutions, save for the most elite ones.
Renick says that although improving graduation rates was the big goal at Georgia State, it became clear that time to degree was the more telling metric.
“The challenge with graduation rates is that they’re often four years or more out,” Renick says. “And so, you lack the ability to really get a nuanced sense of what progress you’re making if all you’re doing is tracking the end goal of a four-year or six-year graduation rate, which are the common federal standards for tracking results. So we started to look for more proximate, early indicators of what will turn into improved graduation rates.”
Graduating students more quickly and before their federal, state, and university financial support runs out is a critical goal for any institution that serves students with limited means, who make up more than 60 percent of Georgia State students, Renick says. The university’s time to degree has decreased over the last decade by a full semester, or about 12 credit hours.
Improving time to degree, Renick says, can reduce the need to improve another common institutional metric—student grant fundraising.
“What we found is that a more efficient and practical way of lowering the obstacles for low-income students [rather than raising more grant money] is just to make sure that students graduate on time,” Renick says. “That’s not being achieved by lessening the requirements to graduate; it’s because we’re advising them proactively and getting them in the right courses and scheduling courses in the right sequence. So they take the courses when they need them and don’t have to waste time. So the savings for students across the graduating class from graduating about 10,000 students a year, each taking 12 fewer credit hours to complete their programs, is about $25 million, which it would not be possible for us to raise for scholarships.”
Another key determinant as to the ultimate graduation rate was the speed with which students determine their majors, Renick says. Interestingly, the relationship was not perfectly linear—sooner was not always better, even for students with limited financial resources. “If a student changes his or her major in the first two semesters of college, his or her chances of graduating actually improve,” he says. In contrast, he notes, if students are still changing their majors in the second, third, and fourth years, their chances of graduating and graduating on time go down exponentially. So Georgia State is also tracking how many students find their “right fit” major within the first two semesters, aiming to raise that number while lowering the number of students who change majors in their second, third, and fourth years. “We found that [this metric] correlates in a very significant way to the success that our students have,” says Renick.
The university has set up programs to help students make informed choices about their majors through a structured process of exercises and instruments that help students see where their strengths are and where their interests lie. Those experiences are structured into all students’ first two semesters. “Students who know why they’re studying what they’re studying are more likely to find a path, graduate more quickly, and graduate at all,” says Renick.
Since 2014 such programs have allowed Georgia State to reduce by 32 percent the number of students who change majors after the first year, Renick says.
Another critical metric relates to understanding that even with federal Pell grants, many low-income students will have to work to make ends meet, which presents implications for graduation timing and available funding as they near graduation. “One of our signature programs at Georgia State, a micro-grant program called Panther Retention Grants, resulted from our analysis of the causes of a failure of students to progress and a lot of seniors who were in their last semester or two before graduation dropping out with no degree,” Renick says. “When we looked at those data more carefully, we found that a lot of these students were running out of eligibility for their aid programs because they were taking more than four years to graduate, because many scholarship programs assume you will graduate by then. But about 80 percent of Georgia State undergraduates are working, and if you are working, it is hard to graduate exactly in four years.”
The program, started in 2011, was driven by university outreach, not by student application: administrators identify students who are close to graduating but have run out of eligibility for their scholarship programs, and provide them with micro-grants to keep them enrolled until they complete their degree program. Prior to that intervention, students who ran out of financial aid before completing all the requirements were graduating at about a 30 percent rate. “Now we’ve increased that number to about 80 percent by keeping the students enrolled,” Renick says.
For working students, such cost considerations can also affect the quality of the educational experience, Renick notes. Study abroad, for example, becomes very difficult for working students because they cannot earn income during the period they are abroad, leading them to fall behind in paying for college. Similarly, unpaid internships that may be important for long-term career development are crowded out by low-skill jobs that pay for immediate needs during school, Renick says. The number of students who must work to afford a college education is thus a key metric to track, he says.
Another critical metric related to graduation rates and academic success more generally is unmet need. According to the National Association of Federal Student Aid Administrators, unmet need is the student’s cost of attendance, minus expected family contribution or family financial responsibility (if applicable), less any need-based aid received, such as gift aid, Federal Work-Study or federal direct subsidized loans.6 “As metrics go, there is no more reliable predictor at Georgia State of GPA,” Renick says. “As their unmet need goes up, their GPA goes down almost in exactly the same line.”
Why? “Part of it is that students who have to work more are more distracted, have more pressures on them, are more likely to be housing insecure, and are more likely to have food insecurities,” Renick says. “But beyond that, these students are more likely to cut corners.” As an example, he notes that students may not buy the books for a course but relying on getting the readings from others. Or they may take fewer credit hours, which extends the time to degree and raises the total expense of the program. “Many will not graduate,” he says.
Georgia State offers a grant program, called Keep Hope Alive, for low-income students on merit-based scholarships who are in danger of losing them due to falling GPAs. “When we introduced that program, we began to see their GPAs improve,” Renick says. “What we do is bring those students into a program where they get some skills-building advice, workshops, they meet with advisors, they meet with financial aid counselors, all with the idea of either preserving the scholarship if they haven’t lost it yet, or winning it back,” Renick says. “And just from a fairly light-touch set of interventions, such as coaching, studying skills, and credit management, we’ve basically doubled the number of students who lose a merit-based scholarship but then win it back again, by pulling up their GPAs to the necessary level.”
Another key metric, the average debt load for Georgia State graduating seniors, has decreased every year from 2016 to 2022, down from $21,430 to $16,929. That contrasts with a national average federal student loan debt that has been increasing and now sits at $37,338.7 That is a key achievement: “Sixteen thousand dollars is well within the realm of what federal loans will allow you to take out without you having to go to private loans or higher interest loans, and so forth,” Renick says. “Driving that number down is critical to improving graduation rates, and especially improving rates for low-income students.”
The efficiency and effectiveness of institution communications with students is another good metric, Renick adds.
“We used to send messages to all our 50,000 students, who would ignore them, because they were getting bombarded with multiple emails,” Renick says. “Now that we have better data sets we can be more precise. Let’s say out of 50,000 students, 150 need to complete this particular form by this time on Friday. We can send a personalized text to those 150 students and ignore the other 49,850 students on that point.” Each of those 150 receives a personalized text; for example, “Stephanie, we know you’re a psychology major and you’re close to graduating in the spring, but it’s really important you get this form in by Friday.” Renick says, “If we send a generic note to 50,000 students, our data shows that sometimes under 15 percent even open the email, given many messages are not relevant to them. But when we send these personalized texts, in some cases we get 70 or 80 percent response rates.”
A key part of Georgia State’s student success progress over the last decade has been finding ways to deliver personalized attention to students at scale and dedicate scarce resources only to students who need them, Renick says. “If we had to award micro-grants to 50,000 students, we would not have anywhere near the resources to do so,” he says. “But if we can find the seniors who are just a few credit hours from graduating and give those students the micro-grants, then we can make a big difference with the funding we have.”
Better Training for Board Members
Since 2021, the Gardner Institute, AGB, the Kentucky CPE, and the boards and key administrators of eight Kentucky institutions have been engaged in a Governing Board Equity in Student Success Project, with funding from Ascendium Education Group. The grant funds an academy for professional development and learning experiences for board members, chief executives, and leadership team members in a single state, as a demonstration project. The project also includes an intensive component on retention performance management for leadership teams, using data and proven strategies to promote student success. (In addition, in 2022, AGB received a grant from the Bill & Melinda Gates Foundation to develop resources for governing board oversight of equitable student success, which were provided to participants in the Ascendium-funded project.)8
The goal of the Ascendium grant is to ensure that trustees have greater awareness of the challenges, opportunities, and strategies that colleges face in achieving equitable student success outcomes, and tools to address these challenges in retention, graduation, and postcollege employment, Koch notes.
The academy is helping boards and institutional leadership teams develop shared language focused on student success and identify any inequitable performance gaps, including through involvement of the board, the president, and the president’s key leaders. “They’re used to hearing financial and enrollment data, but student success doesn’t automatically follow.” He points out that even when class enrollment goals are met, the next year’s class may be larger as a result of an inflow of transfer students, masking retention issues.
The academy helps boards and leadership teams develop proper shared oversight, given student success at the institution, says Koch, and equitable student success is made part of boards’ fiduciary responsibility.
The academy is also designed to give board members who have little exposure to student success initiatives an ability to understand best practices in such initiatives. To that end, the academy has developed a playbook to guide boards and leadership teams participating in the project in looking at and developing a plan for student success.
A second component of the effort, relating to retention performance management, helps each institution develop actionable steps to address gaps and shortfalls.
There is much work to be done. “We did a snapshot poll, and I was astounded by the extent to which board members who responded said they had very limited to no idea about student success, and that it was maybe discussed once a year,” Koch says. “So there tends to be a gap in knowledge.”
Kentucky CPE President Aaron Thompson says he hopes the initiative will help deliver further progress toward state goals for equity progression.
“In Kentucky, we have a strong performance funding model that focuses on closing the student success gap for low-income and underrepresented students,” Thompson says. “I hope all of our campuses, both public and private, will use the results of this initiative to make sure that their boards are heavily engaged, and asking the kinds of questions that they need to ask, and that they are on track.”
While which metrics to track may depend on the institution and the time period, there are some obvious ones, Koch says. “If I’m on a board, I’m going to want to know our aggregate retention rates—not just first to second year, but year to year, up to and through completion,” Koch says. “What are aggregate graduation rates, in a two-year environment, at least three and four or five years out? In a four-year environment, three, four, five, six, and eight years out.”
Then there is a need to disaggregate those aggregated rates. “They should ask, ‘are there any performance gaps, or populations, whether it’s by race, ethnicity, residential versus non-residential students, perhaps student athletes compared with non-student athletes,’” Koch says. “Probing the answers to these questions can lead to actionable solutions.”
Even seemingly equitable procedures, such as first-come, first served, can lead to inequity, Koch says. “We’ve found with some institutions that do first-come, first-served for access to residence halls, the students who end up with bad internet and in the worst residence halls are first-generation students or disadvantaged racial or ethnic minorities who do not know how the system works,” Koch says.
Whether educational and extracurricular opportunities are universally available is another key factor. “How many students participate and how do they do?” Koch asks. “Institutions that talk about flagship programs, and they’ll have 450 or 4,500 incoming first-year students, but the flagship program actually only supports 50 of them,” Koch says. “There’s often a dissonance between what we brag about and what actually our students broadly can do.”
Another key metric is student performance in critical high-enrollment, high-risk courses, including which groups of students pass them, Koch says. “I think it’s shocking, the degree to which when a student fails even one foundational-level course, that is correlated with not coming back the next year,” he says. Data on DWFI rates (drop, withdraw, fail, incomplete) for gateway courses in student progress provide insights about roadblocks and about subgroups of students that the institution is failing.
Renick says this was another area addressed at Georgia State. “We were having a lot of trouble with our students in economics: In the first couple of semesters, they were taking micro- and macroeconomics courses, which are not only required for economics majors, but for every business major, and then were not passing them at a high rate,” Renick says. “It turned out that the students were really struggling in the first three or four weeks of the course and were getting off path almost immediately, whereas instructors were under the assumption that students were understanding and digesting material at a higher level than they were. So we amassed data from several semesters and had conversations with the Department of Economics, and this led to a restructuring of the way they teach the first few weeks of those classes.” As a result, Georgia State now offers a version of microeconomics that involves support from artificial intelligence (AI) chatbots, which help students test themselves and answers their questions 24/7. The university has also set up an economics lab where students can get help during business hours, five days a week, doing exercises on the spot and getting immediate feedback.
There is also a need for boards to examine a larger set of the demographic metrics of students, Koch says. “Boards need to be constantly reacquainted with who their students actually are,” Koch says. “Because the demographics are shifting so rapidly, there are board members, particularly board members who might be alums of institutions, who think of the student body in a way that it actually isn’t.”
The onus should be on presidents and key administrators of higher education institutions to curate a discussion with their boards that highlights what the key metrics are, how they are changing, and how the institution is addressing them, Koch says. “There’s no way, or almost no way, that a board member who’s spending the overwhelming majority of their time running a firm, doing other things, and coming periodically to board meetings can be on top of this—even reading this stuff in advance of board meetings.”
But the board has ultimate responsibility for tracking and addressing student success. “If you don’t have a committee for it on the board, you have to ask yourself why you don’t,” Koch says. “If you have it as the responsibility of one committee, you have to ask yourself, how is that getting back to the rest of the board? It’s an overall board responsibility, so it needs to be factored into the committee structure and factored into the broader board conversations.”
Identifying Good Metrics Can Be a Good Team Sport
For many higher education institutions, economic projections can often translate into metrics, as was the case for CSU.
A report that looked at the future workforce needs of California indicated that by 2030, the state was going to need an additional 1.1 million baccalaureate degree holders to meet workforce demand, Gold says. That led to a student graduation initiative at CSU featuring development of a strategic framework, buttressed by a series of campus and system student success metrics, that were formed through an “all hands on deck” approach that involved representatives from all corners of the institution, including trustees.
To establish a foundation for setting achievable but ambitious goals, the institution turned to peer benchmarking in 2015. “We spent the rest of the summer compiling and analyzing peer institution data at the individual campus level,” Gold says. “For every CSU campus we identified 10–15 similar campuses across the nation with comparable institutional profiles, structures, and student demographics, and we used this information as the basis for establishing improvement targets.”
CSU set a goal that by 2025, graduation rates at each campus would improve to the top quartile of the peer benchmark group. Those campus goals were aggregated to form the goals for the CSU system.
This intensive goal-setting process provided a unifying framework for Graduation Initiative 2025, CSU’s signature strategic effort to improve graduation rates, eliminate equity gaps, and facilitate the path to a high-quality college degree for an additional half million students.
“While firmly committed to a data-informed goal-setting methodology, we were concerned that having too many goals might dilute our focus” Gold says. “And so, we agreed on six different metrics, including two goals for first-time student graduation rates, two for transfer students, and two for eliminating gaps between the graduation rates of historically underserved students and their peers.”
Eight years into the initiative, CSU has made remarkable progress in improving graduation rates, but equity gaps remain.
“CSU graduation rates are at or near all-time highs for all students. And I think that last part is particularly important,” Gold says. “It’s not just that there’s a small cluster of students that have made exceptional gains; rather, all groups of students—disaggregated by race, gender, ethnicity, and socioeconomic status—are completing college at rates that are at or near record levels.”
But some areas have remained persistently challenging, Gold says. While graduation rates for students from low-income families and those who hail from historically underserved communities have improved, the increases have been roughly the same as for other student groups, and equity gaps have thus failed to close.
As 2025 approaches, CSU is engaging its campus community on strategies for formulating a more inclusive and targeted set of goals, which may include metrics tied to social mobility and workforce prosperity, Gold says.
Postgraduation Success
Measuring postgraduation success is increasingly a focus of metrics development—and an area of divergent assessments of the best metrics. The focus on such metrics, such as return on investment (ROI), is sharpening because of growing public skepticism about the value of a college degree and because of enforcement on the industry from above.
Since 2013, and as augmented in 2015, the U.S. Department of Education’s College Scorecard (https://collegescorecard.ed.gov) has made a wide variety of institution metrics available on its website, notes Michael Itzkowitz, former director of the College Scorecard during the Obama Administration and now founder and president of the HEA Group, which consults on higher education policy development, data analysis, and government relations.
The College Scorecard measures “whether students graduate from college, get a decent-paying job, and can pay down debt,” Itzkowitz says. In 2015, it was expanded to include a lot more data on labor market outcomes. “For the first time ever, we could actually see how much students at an institution were earning within a certain amount of years after they had enrolled within that institution,” Itzkowitz says, noting that more than a million consumers visit the College Scorecard website each year.
Several years ago, after leaving the U.S. Department of Education, Itzkowitz created a new metric, the price-to-earnings premium, that looks at the cost that students pay out of pocket to obtain a postsecondary credential relative to the earnings premium that they receive by either attending a specific college or graduating from a specific field of study. The combination of those metrics allows one to see how long it takes students and graduates to recoup their educational costs after they either attend a specific institution or graduate within a certain major.
The aggregate overall findings were positive ones. “What we can see is that college is still worth it,” Itzkowitz says. “The majority of college degrees allow students to recoup their educational costs within 10 years or less, which is a really good sign for higher education—even for non-tech majors like sociology or education, though for those programs it may take relatively longer. But what we also saw is that about 14 percent of college degrees provided no economic return on investment whatsoever, meaning that the majority of their students earn less than the typical high school graduate even 10 years after they initially enrolled.”
Scrutiny of postgraduation results at institutions will increase later this year, when federally required reporting of metrics on earnings and debt for graduates kicks in, allowing the Department of Education to calculate debt-to-earnings rates. (Editor’s note: see the “Legal Standpoint” column in this issue of Trusteeship.)
There is now no excuse for higher education institution executives and trustees to not examine the value propositions of their institutions and majors at their institutions, Itzkowitz says. “It’s really important for administrators and trustees at an institution to have a good understanding of which college majors are producing which outcomes for the students that attend a specific institution,” Itzkowitz says.
Poor ROIs should trigger further examination of programs.
Over the past decade, Wyner has seen colleges take several measures to address programs of study with poor earnings prospects. Among them are changing program curricula to ensure that students have needed job skills, such as a bachelor’s program in fine arts incorporating entrepreneurship skills and teaching credentials; making the case to increase entry-level wages with employers who rely on streams of graduates; shortening the length of programs or subsidizing tuition to reduce graduates’ debt loads; or, if such measures won’t suffice, closing down underperforming programs.
Some higher education institutions are taking the approach of enhancing postgraduation career prospects by embedding shorter-length credentials into academic programs. In 2021, the University of Texas System, which has more than 240,000 students, implemented Texas Credentials for the Future, a program of microcredentials embedded into bachelor’s degree programs and undergraduate experiences at university institutions to help college graduates distinguish their education and talent with in-demand, industry-recognized skills.
“If you’re able to pair a degree, which provides you what we call long-term durable skills, with some specific skills that help you address the near-term needs of the marketplace, that leads to a lot of benefits—both economic, in getting jobs, but also based upon greater job satisfaction,” says Archie Holmes, University of Texas executive vice chancellor for academic affairs. Through the program, the university system makes available Coursera’s Career Academy industry certificates to students enrolled at its academic institutions at no additional cost, Holmes says. More than 3,000 students currently enrolled in credential programs.
Other higher education institutions are embedding experiential education expectations for students. At Grand Valley State University (GVSU) in Michigan, by 2025 every student will be required to engage in an experiential education “voyage,” including at least one experiential learning opportunity outside of GVSU and an additional experiential learning opportunity either within the classroom (such as a part of a class, project, or class initiative), or within the university, notes GVSU President Philomena Mantella. Other components of the Voyage program include an embarking experience to help students understand the purpose of the program and its relevance to their curriculum, as well as a portfolio that helps them translate experiential learning and integrate curriculum content that is understandable or marketable for the workforce, she adds.
Boards may also want to examine how much time they are spending on alignment of programs with employment outcomes, says Kysha Wright Frazier, president and chief executive of Corporation for a Skilled Workforce, a non-profit that advances policies and practices that improve economic mobility, particularly for people of color and other historically excluded groups. There is a very direct relationship between the level of higher education effort in aligning educational programs and the actual employment results, such as through meaningful conversations with employers, says Wright Frazier. “How much resource allocation is the college dedicating to these kinds of conversations?,” she asks. “Is it really dedicated time? Or is it something that you’re just squeezing into somebody’s already busy day-to-day?”
Another way of measuring outcomes is by student or graduate satisfaction. The validity of surveys of satisfaction with degree and educational experience is hotly debated. Carnevale is a skeptic. “What you’re getting there is, have they sent letters to their alumni and [asked, ‘are you] happy?,’” Carnevale says. “And for some reason, those letters always come back and say yes; when neutral observers do surveys, they say no.”
Are the dissatisfaction results, particularly those further out from graduation, meaningful? “We’re getting numbers now that 30 or 40 percent of people who go to college wish they had it to do over again and would do something else, like major in another subject,” Carnevale says. “But I think that this is unfair. Because, of course, there are things that you did when you were 20 that you regret when you’re 40. I think the real answer for them is we should make all the data we can transparent, and then people have to live with their decisions.”
Others differ in their assessment. John Barnshaw, vice president for educational success at labor market analytics company Lightcast, does see value in satisfaction surveys.
For people who are earning degrees, “there is a subjective aspect as to what people see as the value of their degrees,” Barnshaw says. “If they’re not that satisfied with their degree, I think that that matters for an institution from a development perspective, such as their willingness to donate.”
Barnshaw also points to more nuanced surveys that may better measure educational value, such as a 2014 Gallup–Purdue University survey that identified a set of Big Six college experiences that resulted in greatly increased satisfaction ratings, if all members in a population enjoyed them. Experiences, captured in statements, included “I had at least one professor at [college] who made me excited about learning” and “My professor at [college] cared about me as a person.” The 2014 survey found that just 3 percent of all college graduates in the survey said they had all six of the experiences in the Big Six, which Gallup–Purdue said strongly relate to whether respondents felt their colleges prepared them well for life and bettered their chances of receiving their degrees on time.9
Using Metrics to Target Inequity
As noted earlier, tracking and ensuring greater equity is an increasing focus of higher education institution metrics.
In addition to the efforts to disaggregate data to determine progress and attainment of degrees and credentials described earlier, economic mobility is another metric that is increasingly being tracked as a supplement to ROI, notes Itzkowitz, who developed an approach to tracking it—an economic mobility index. “A different group of institutions rise through the ranks to lead in this category, all of which are Hispanic-serving institutions located in New York, California, and Texas,” Itzkowitz says. “And they enroll a lot of students from low- to moderate-income backgrounds who graduate and get good jobs, leaving them better off.”
“No matter what formula you use, you will almost always see Cal State campuses heavily present in the top rankings of social mobility powerhouses,” CSU’s Gold says.
Also important is tracking graduate progression from internships with employers through jobs with them for graduates who join them through an equity lens, Wright Frazier says. “And often you see internships or apprenticeships, especially apprenticeships, are within occupations that are male-dominant occupations,” she says. “So how do we create internships and other types of opportunities that don’t segregate folks. It can be hard to get that data, but I think if you create those valid relationships with employers, you’d be better able to get some of that information from them.”
Gold, now chief executive of Insights2Action (https://www.insights2action.org), a student success business, is building upon his work at CSU to develop an AI data visualization tool that seeks to democratize student success data across campus and promote better tracking of equity. “The service we’re providing is an AI-driven set of reports that curates and personalizes insights into an easily digestible format, enabling all members of the campus community to identify opportunities to better serve students,” Gold says.
Some states, such as Kentucky, are tying equity metrics to funding of higher education institutions. “We’ve connected metrics with our performance funding model; for example, we look at overall degree and credential output,” says Thompson of the state CPE. “We look at graduation and retention rates, and if you look at our performance funding, we look at our overall output based on demographics, and we pay them for that—and when they do well with underrepresented or low-income groups, they get extra.”
Data Transparency and Visualization
As this foray into metrics highlights, student success metrics and related trends, correlations, and implications can be complex and interwoven. Data visualization, whether by in-house data units or third-party consultants, can be important to enable proper understanding of content.
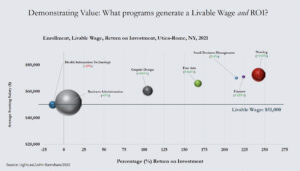
More than 1,000 U.S. higher education institutions use Lightcast’s processing of labor market data to help tease out relationships between programmatic offerings, available jobs and skills in demand, and employment outcomes, and to help visualize those relationships. As an example, the figure shows different programs of study at a community college in relation to postgraduation outcomes. It indicates which programs in the Utica-Rome area of New York in 2021 generated a livable wage and ROI, by comparing average starting salary, percentage return on investment, and number of available jobs. Thus, nursing programs demonstrated a 242 percent ROI and a mean wage of nearly $70,000, above the area’s minimum livable wage of $51,000, whereas health information technology, while offering a larger pool of jobs, provided a negative 13 percent ROI and a mean wage that was almost exactly at the minimum wage level.10
Going Beyond the Numbers
Yet despite the host of metrics in use, many interviewed for this article assert that much remains to do, to go beyond the numbers to more fully capture the value of higher education and achieve satisfactory results.
CIC’s Hass says that determining the long-term value of degrees at independent colleges may need greater and more nuanced contemplation: “Our sector sends a higher proportion of students on to graduate and professional school,” she says. “Many of our institutions have a religious foundation, and at some of those institutions, it’s not uncommon for students to do a mission year after graduation or to engage in social service. They’re using their education to build social capital for the country in a way that is not adequately measured by the current metrics. We certainly are interested in lifetime success, but we need to measure it more holistically than simply relying on what salaries are right after commencement.”
Some say there is also a need to look beyond the metrics for the underlying reason behind them. “I think many of these institutions feel a moral obligation to students,” says Nanci Tessier, a principal at Art & Science Group LLC, a Baltimore-based consulting firm that offers market-informed strategy to higher education, independent schools, and the non-profit sector. “They didn’t bring students there for a year; they brought them there to graduate. But there’s also a business model that only makes sense if you’re retaining students on to graduation.”
David Tobenkin is a freelance writer based in the greater Washington, D.C. area. This story includes research that he and Adam Atwell, a senior research analyst at Jobs for the Future, performed under an ECMC Foundation grant to study college initiatives on labor market data.
1. California State University, “Graduation Initiative 2025,” https://www.calstate.edu/csu-system/why-the-csu-matters/graduation-initiative-2025; “Graduation Initiative 2025: Progress Report 2022,” https://www.calstate.edu/csu-system/news/Documents/GI2025-Progress-Fact-Sheet-2022.pdf.
2. Anthony Carnevale and Nicole Smith, “Opinion: Training programs are welcome, but let’s not overlook the benefits of a bachelor’s degree,” The Hechinger Report (December 5, 2022), https://hechingerreport.org/opinion-training-programs-are-welcome-but-lets-not-overlook-the-benefits-of-a-bachelors-degree.
3. Anthony Carnevale, Megan L. Fasules, Stephanie A. Bond Huie, and David R. Troutman, “Major Matters Most: the Economic Value of Bachelor’s Degrees from the University of Texas System,” (Texas University System and Georgetown University, 2017), https://files.eric.ed.gov/fulltext/ED590598.pdf.
4. Board of Regents of the State of Louisiana, “Louisiana Prospers: Driving Our Talent Imperative, Final Report on Master Plan (September 2022),” https://www.laregents.edu/wp-content/uploads/2022/09/Full-Report-FINAL.pdf.
5. Board of Regents of the State of Louisiana, “Gaining Meauxmentum: Regents Announces 49.5% Educational Attainment Rate, Releases Master Plan Year Four Update,” https://www.laregents.edu/092023release/.
6. National Association of Student Financial Aid Administrators, “Glossary of Terms for Financial Aid Offers,” https://www.nasfaa.org/glossary.
7. Melanie Hanson, “Average Student Loan Debt,” (Education Data Initiative, May 22, 2023), https://educationdata.org/average-student-loan-debt.
8. AGB, “Board Responsibility for Equitable Student Success,” https://agb.org/student-success-initiatives/board-oversight-of-equitable-student-success.
9. Julie Ray and Stephanie Marken, “Life in College Matters for Life After College,” (Gallup, May 6, 2014), https://www.gallup.com/poll/168848/life-college-matters-life-college.aspx. Sean Seymour and Shane Lopez, “‘Big Six’ College Experiences Linked to Life Preparedness,” (Gallup, April 8, 2015), https://news.gallup.com/poll/182306/big-six-college-experiences-linked-life-preparedness.aspx.
RELATED RESOURCES

Reports and Statements
Board Responsibility for Equitable Student Success

Tools and Toolkits
Justice, Diversity, Equity, and Inclusion Toolkit