
 Chat with AGB Board Bot
There are many important decisions that investment committees make when stewarding endowments or other perpetual pools of assets that support their missions. Of all of them, asset allocation is generally considered to be the preeminent, which is perhaps based on an age-old adage that asset allocation accounts for 90 percent of all returns. That statistic, which is often quoted in the investment industry, comes from a seminal study conducted by Brinson, Hood, and Beebower (BHB) titled “The Determinants of Portfolio Performance” and was published in the Financial Analysts Journal in 1986. Like so many stats that are often quoted but rarely understood, there are important nuances to the BHB study.
The original study, which was confirmed by an update from BHB in 1991, focused on demonstrating that more than 90 percent of the variability in returns of a portfolio was explained by asset allocation. The remaining 10 percent of the variability was explained by manager or security selection and market timing. Importantly, the study did not consider asset allocation’s impact on the total return of a portfolio or relative performance across different portfolios. In other words, BHB found through regression analysis that the variability of a portfolio’s returns quarter-to-quarter was largely determined by asset allocation, but their research did not address the potential impact on portfolio absolute performance or relative performance versus other portfolios.1
Years later, Roger Ibbotson and Paul Kaplan addressed all three considerations in their 2000 study titled “Does Asset Allocation Policy Explain 40, 90, or 100 Percent of Performance?”2 In that study, the authors confirmed BHB’s conclusion that 90 percent of the variability of returns of a portfolio across time was explained by asset allocation. Put simply, most of a portfolio’s rises and declines were attributed to the rises and declines of the overall market. They also concluded that 100 percent of a portfolio’s absolute return (total performance) over the entire period they analyzed was explained by asset allocation but that only 40 percent of the variation in returns among portfolios (relative performance) was explained by asset allocation. In short, the authors concluded that the asset allocation decision was highly important in determining total returns of a portfolio, very important in determining the variability of a portfolio’s returns and only marginally important in determining the performance of a portfolio relative to others.
With the understanding that asset allocation is indeed an important driver of returns in mind, we endeavored at Commonfund to answer the question “within asset allocation, what is the most important decision we need to make?” For our study, we specifically focused on understanding what factors, or “decision levers” explain the differential in asset allocation among nonprofit investors. In order to conduct the analysis, we analyzed data for approximately 800 endowments of higher education institutions over eight years.3 Like the previously mentioned studies, we used regression techniques to understand the importance of various factors on historical asset allocation differentials across these institutions, and ostensibly performance. Observers of higher ed peer studies often conclude that the larger endowments out-perform the smaller ones. And while in many years that is the case for longer term performance, it is not size alone that drives performance. As they say in statistics: Correlation does not imply causation, and in this case the observation does not shed light on why larger endowments historically outperform smaller endowments.
In our analysis, we found that there were five factors that explain most of the differential in asset allocation and therefore returns, across institutions. These factors, or “decision levers,” included the relative weighting of stocks versus bonds, the geographic mix between U.S. and non-U.S., the degree to which institutions were using active or passive investment strategies, and the amount of hedge fund exposure and exposure to private investment strategies. Interestingly, though, the five factors did not equally explain asset allocation differentials. In fact, the analysis demonstrated that private investment exposure4 was the largest determinant in relative differentials by a wide margin.
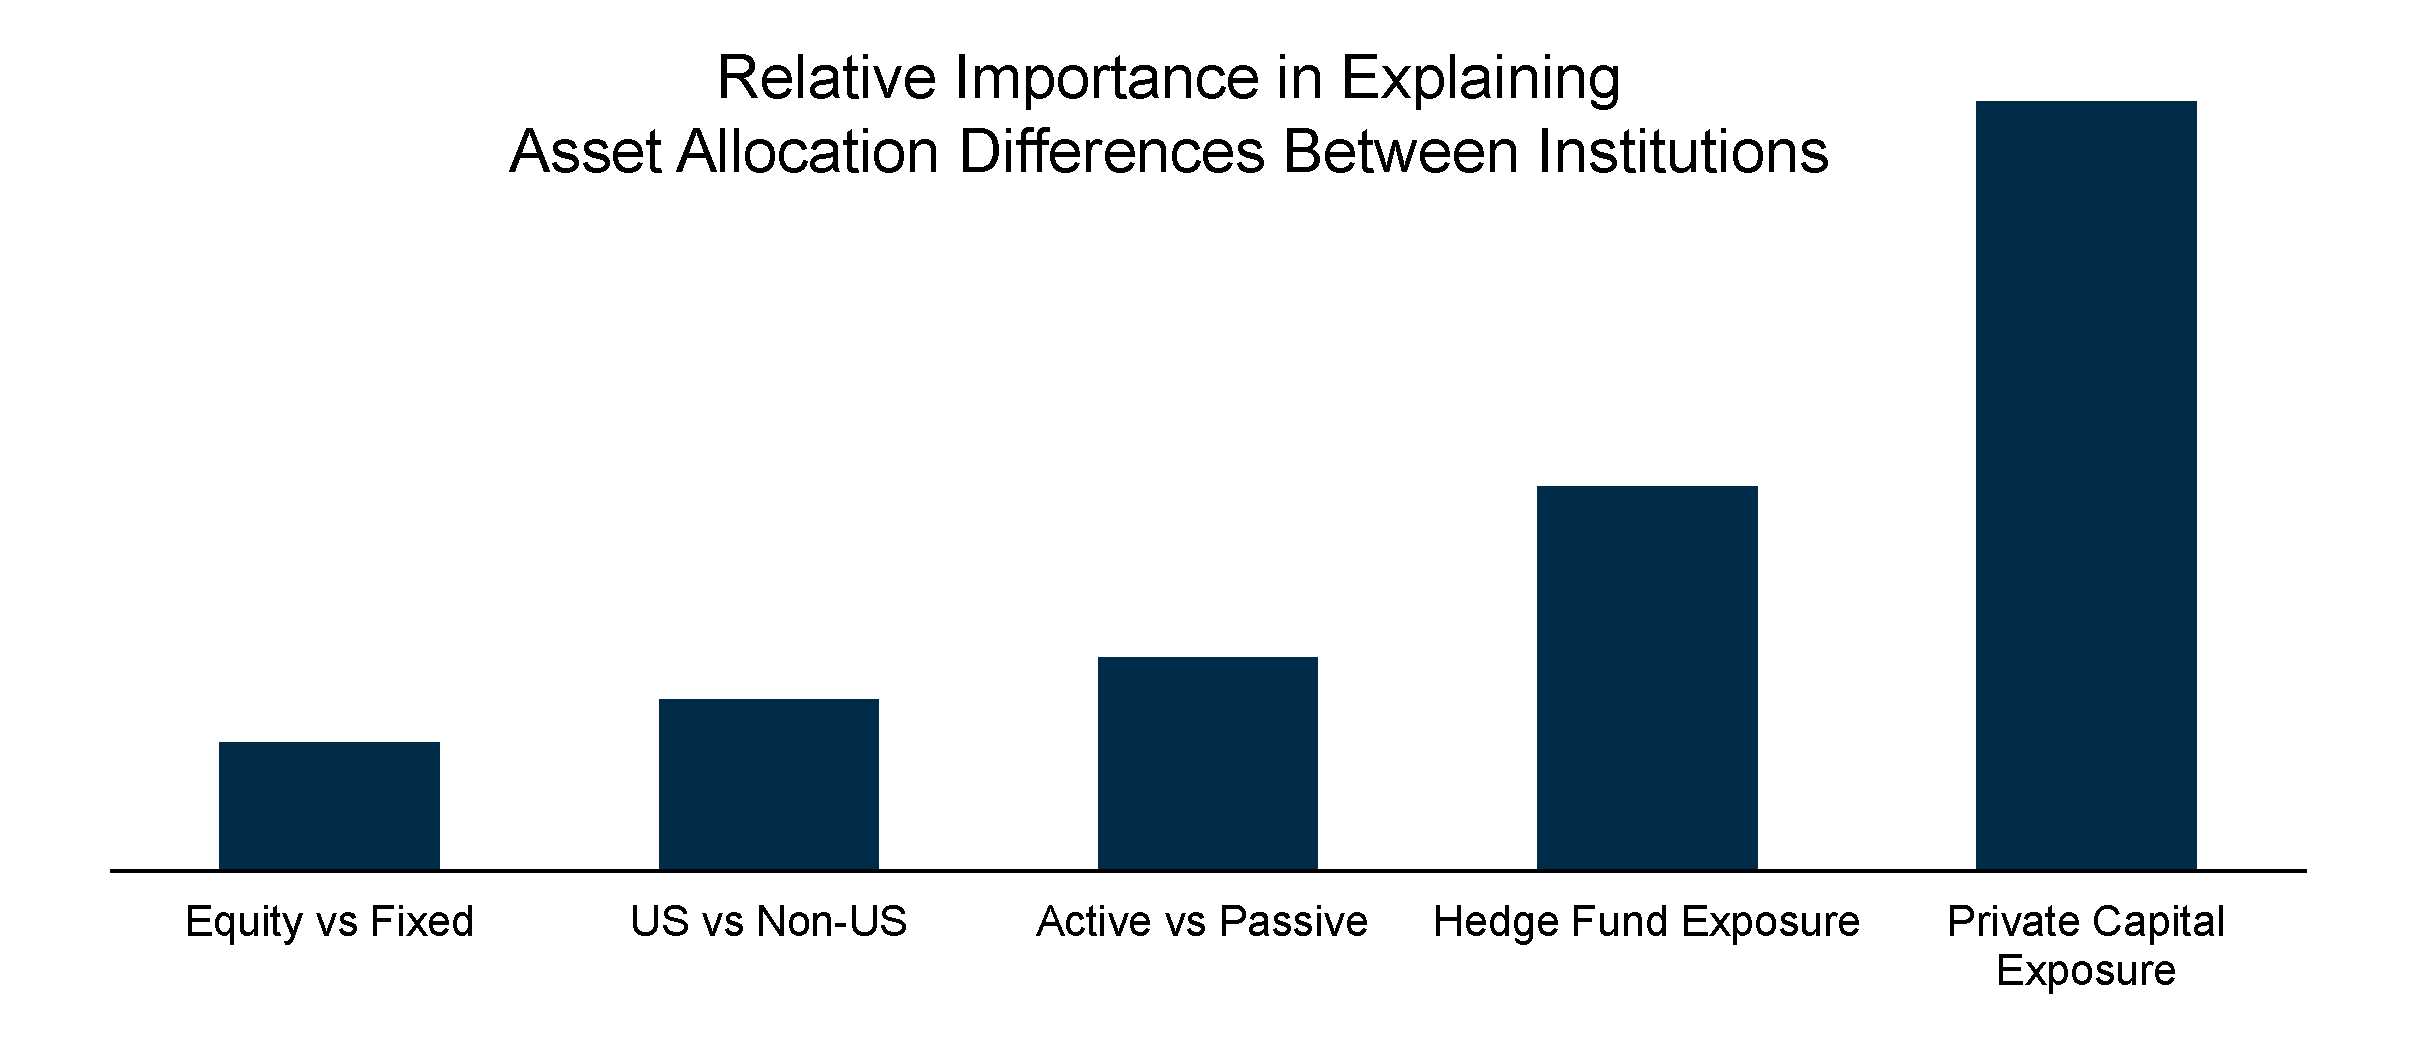 Note: This chart is a simplified representation of a non-negative matrix factorization analysis of the asset allocations of participating institutions in the NACUBO-Commonfund Study of Endowments 2010–2017.
To be clear, the conclusion of the chart (right) is not that private investment strategies outperformed hedge funds or that those institutions with private investment strategies generated higher returns than those without. The conclusion is that the exposure to private investment strategies explained the differential in asset allocation, more so than any other factor or decision lever. Knowing that asset allocation is the most important determinant of performance and knowing that private investment exposure is the most important decision within asset allocation we surmise that it too is a key determinant of portfolio performance. Indeed with wide dispersion among institutions in how much they allocate to private investments as well as wide dispersion in the performance of many of those strategies, it makes logical sense that the decision to allocate a certain amount to private investments, and the performance of those investments, is a critically important one.
Complicating the decision regarding an allocation to private investment strategies is that not all private strategies are created equal. In many cases, there has been exceedingly wide dispersion between top performing managers and bottom performing managers within many private investment strategies. As a result, while one might have made a policy decision to allocate more to private investments in pursuit of higher returns only to have that decision offset by manager or fund selection shortfalls. If we consider venture capital as an example of this dynamic, we can look at historical data for the universe of venture funds and see the large dispersion in performance over the past ten years—much wider than public equities, for example.
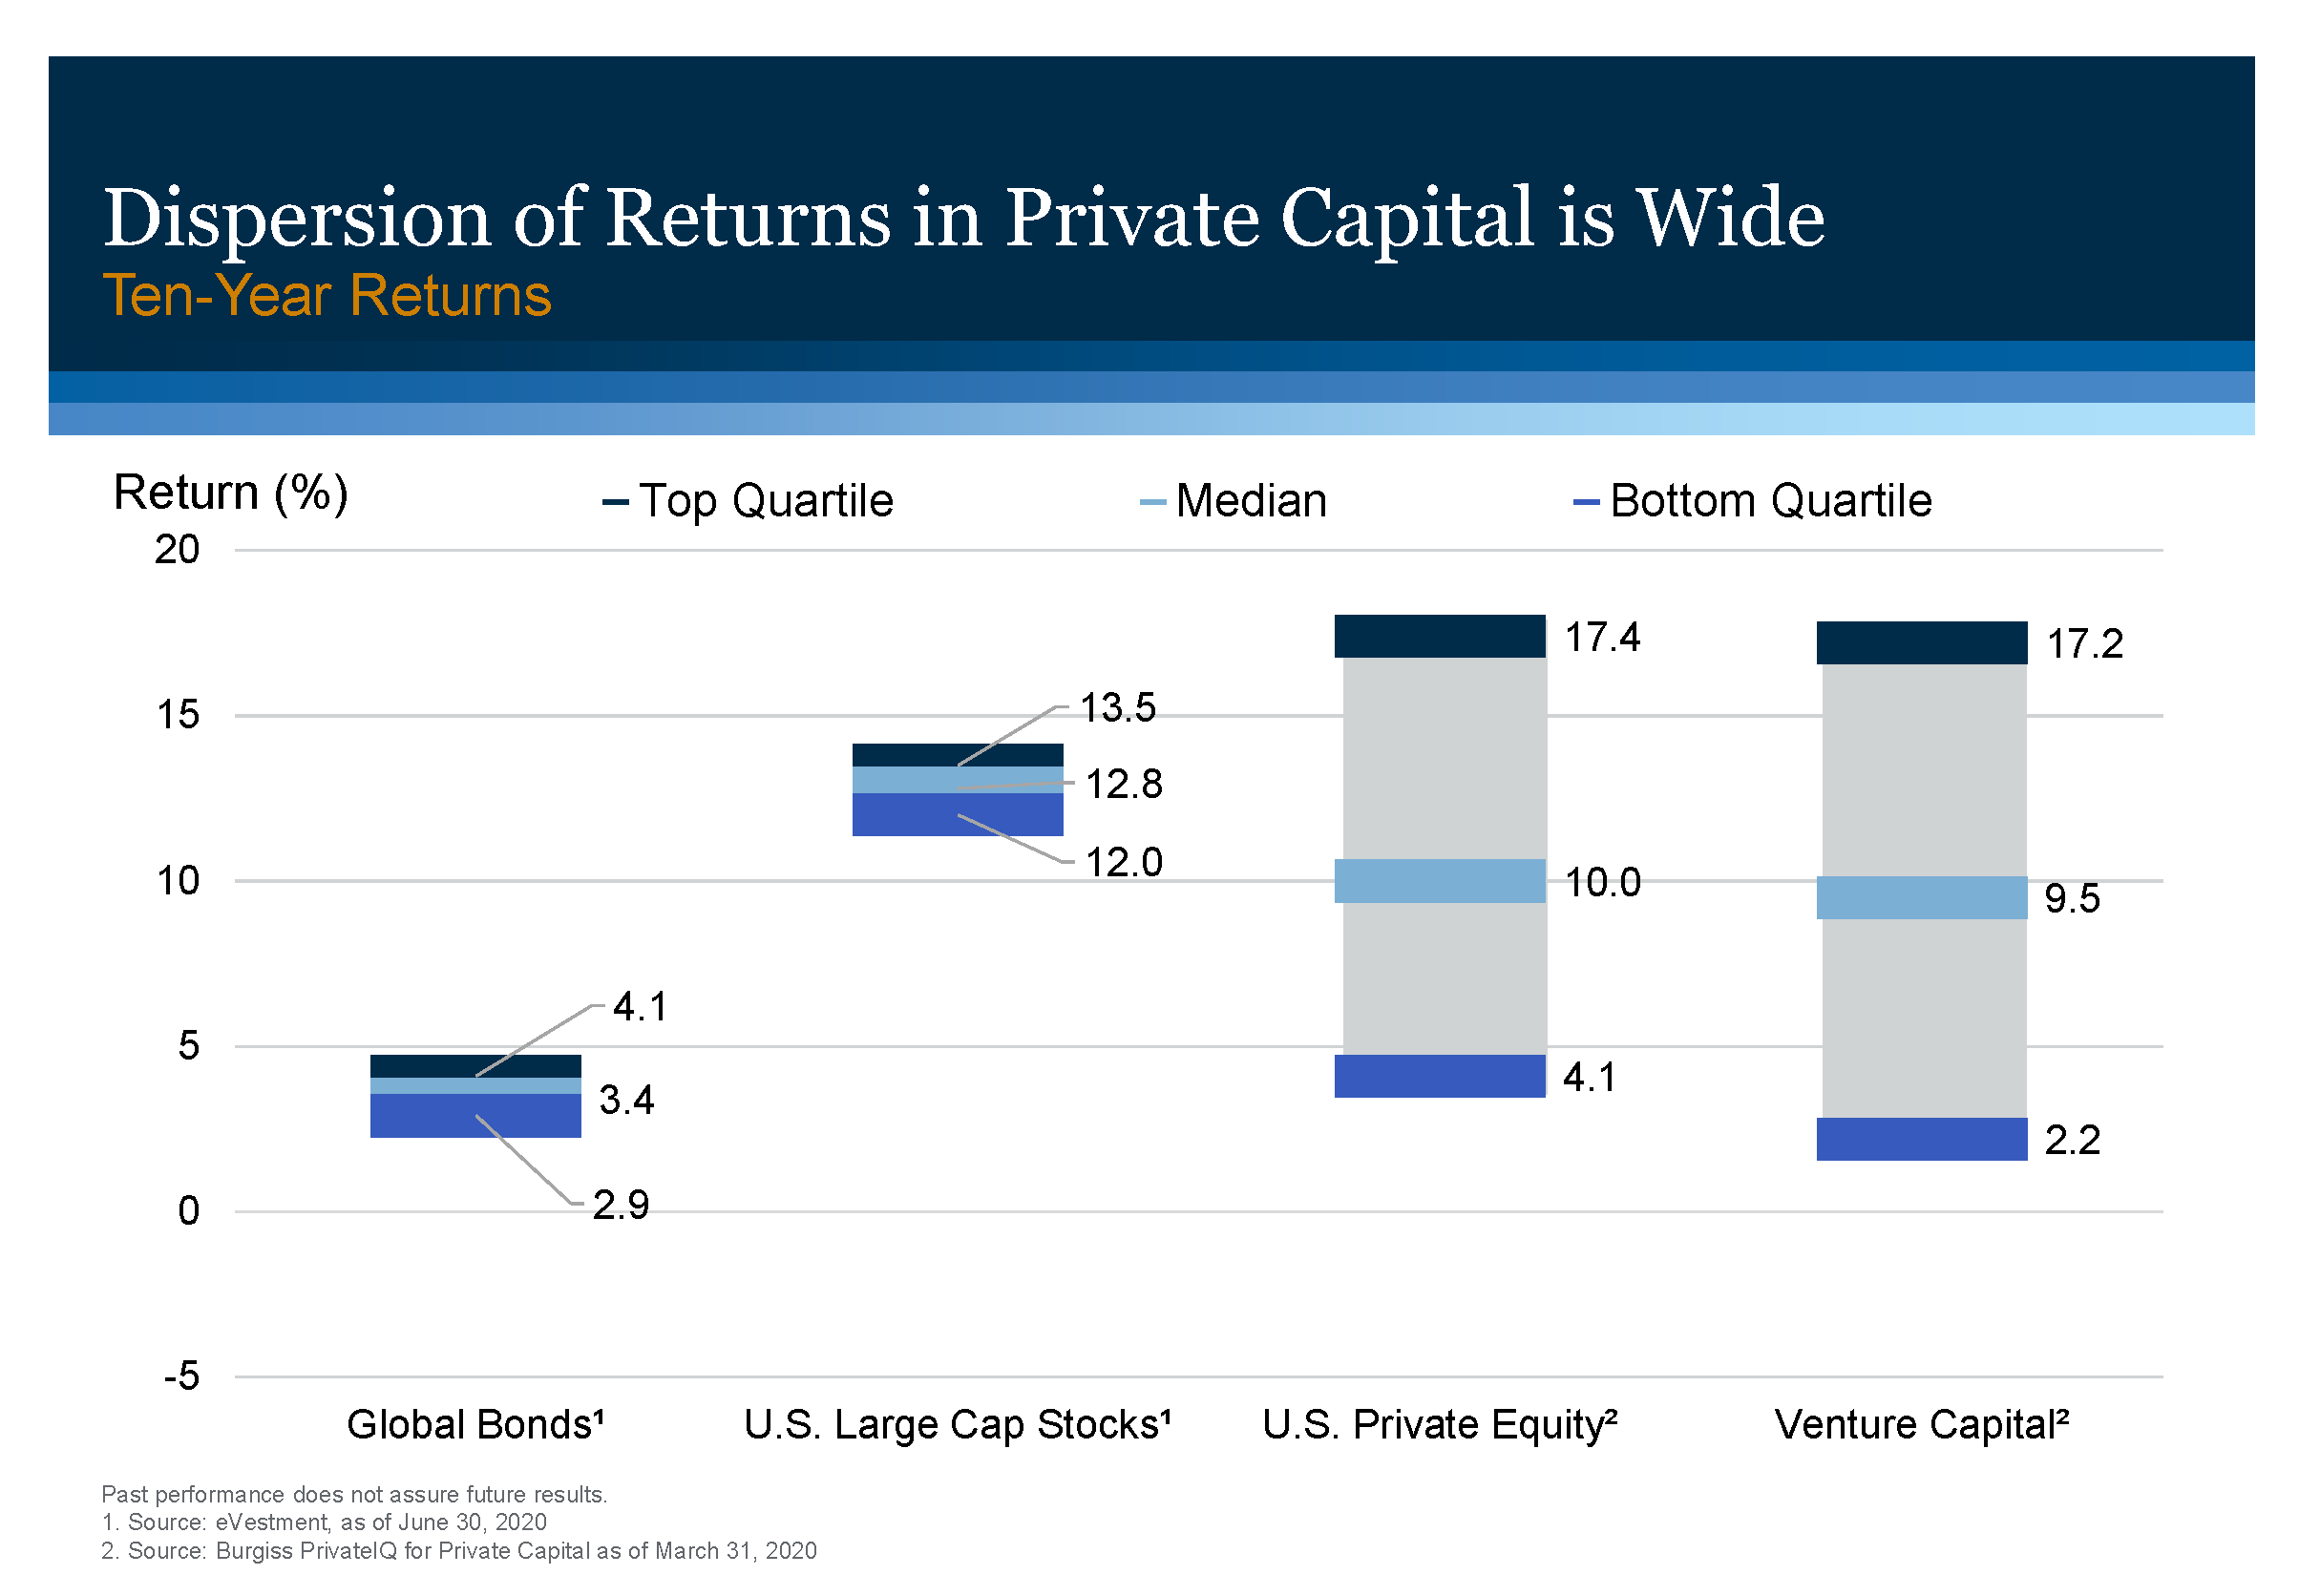 Not only has there been wide dispersion over the past 10 years in venture capital returns, but the median return of 9.5 percent is less than the median return for public equities. Essentially, more than half of the venture capital funds over the past ten years failed to outperform public equities and deliver any premium for the illiquidity risk that their investors assumed. The premise is that you may not be rewarded for taking that illiquidity risk, or conversely your ability to execute and capture a return premium, should be a key consideration in the decision to pursue private investments. Because there are no indexes or passive substitutes, the allocation decision alone isn’t enough. All of that said, we believe there is premium to be captured by investing in private investments relative to public markets. Capturing that “liquidity premium” over public markets, which we estimate can be 200–400 basis points annually, may make the difference in attaining an institution’s long-term return objective.
More practically, the decision to invest in private strategies is a decision that requires patient planning and locking up capital for longer periods of time. Without the flexibility to quickly undo a private capital allocation or decision, which in and of itself makes it an important decision, investors must also consider the appropriate amount to allocate to private investment strategies such that they maintain an acceptable liquidity position in their portfolios. Determining the right size for a private investment program or policy allocation is based on finding the intersection between the need, ability, and willingness to take on illiquidity. An institution’s need reflects the return objective required to sustain the mission in perpetuity. Variables such as spending rate, inflation expectations, costs, and contributions, are some of the contributors to determining a return objective. These inputs should be paired then with asset allocation modeling to answer the question: “How much illiquidity do we need to achieve our long-term return objectives?”
Once answered, the subsequent question is: “What is the ability of the institution to take on illiquidity?” Importantly this question must be asked and answered at both the portfolio level and at the institutional level. There are internal and external sources and uses of liquidity that must be understood. At the portfolio level, spending and contribution flows, cap calls, and distributions and rebalancing transactions are all sources and uses of liquidity. At the institutional level, revenues, debt capacity, contributions, and draws on unrestricted endowment or special appropriations are among the liquidity dynamics that must be considered. As such, the ability to take on illiquidity, or make investments in private programs, is unique to each institution and should be based on scenario analyses that evaluate normal and stressed environments and the interconnectedness of portfolio and institutional liquidity sources and uses. We need to ensure that the endowment has sufficient liquidity to meet normal operating conditions but, perhaps more importantly, also when institutional liquidity needs are greatest. As history has reminded us, those periods of higher liquidity need too often coincide with capital market dislocations that may impair the portfolio’s ability to provide that liquidity.
The third factor that forms the intersection of the decision to allocate to private programs is the willingness of the fiduciaries to make that choice. Admittedly more qualitative in nature, it is harder to gauge this factor. One technique we have used successfully at Commonfund is an anonymous risk survey of 20 questions that is sent to members of an investment committee and/or staff with the results discussed in a live setting. Such an exercise is helpful in establishing a foundation of each decision maker’s perspective and encouraging discussion among the group.
In an ideal world, the need to take on illiquidity matches the ability and willingness to do so. However, an ideal world is rarely the real world and as a result there are often trade-offs to be made. Having a framework around these factors and data-driven analysis will help prioritize those trade-offs. Without such a framework, you may be left in the dark making a very important decision. After all, the degree of exposure you have to private investment strategies, coupled with how well you execute those strategies, may not be the most important decision you make. But it very likely will explain how you perform over the next 20 years against everyone else.
Tim Yates is the president and CEO of Commonfund Asset Management.
Endnotes
- While this is the most important nuance, it is also important to note that the original BHB study was based on the 10 years of quarterly returns starting in 1974 from 91 large corporate pension plans. Moreover, the returns collected for the study were based on domestic equities, marketable bonds, and cash only. The average asset allocation for those 91 large corporate pension plans was 57.5 percent domestic equities, 21.4 percent marketable bonds, 12.4 percent cash and 8.6 percent other (which captured all other asset classes but was excluded for much of the analysis).
- Published in the Financial Analysts Journal in 2000, the authors used 10 years of monthly returns for 94 balanced mutual funds and 5 years of quarterly returns for 58 pension funds. Like the BHB study, Ibbotson and Kaplan only considered stocks, bonds, and cash in their asset allocation analysis.
- FY 2010 – FY 2017 using NACUBO-Commonfund Study of Endowments data.
- Private investment strategies include private equity, real estate, natural resources and venture capital.