
 Chat with AGB Board Bot
Opinions expressed in AGB blogs are those of the authors and not necessarily those of the institutions that employ them or of AGB.
Having a student record-level data asset with over 10M enriched and normalized student records gives us at Farrell Day the unique ability to help our partners evaluate student and family behaviors in real-time for an empirical look of how the market is taking shape.
Throughout yield season, beginning with the early March onset of the pandemic, we provided our MARKETview clients with a weekly macro-digest of how yield rates and volumes were trending across the country. We broke these rates and yields down by a variety of characteristics important to goals and outcomes such as deposit deadline (May 1 v. June 1), distance from campus, ethnicity, consumer characteristics, and cohorts.
What follows is the high-level analysis we shared on June 2 of how the deposit dust settled in this historic year of two deadlines.
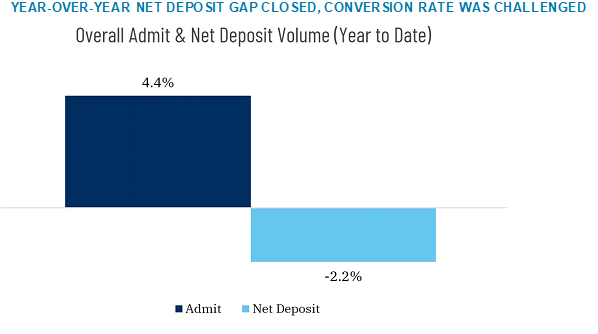
As of June 2, total admits were up 4.4% year-over-year, but conversion challenges continued to impact yield. The real story since the May 1 deadline, however, is net deposits. While net deposit volume is down 2.2% year-over-year, this represents a meaningful, double-digit improvement in percentage points since May 1.
Early Insights & Observations
May 1 proved to be a false peak, as net deposit activity persisted for all in the deadline-to-deadline race across May.
As of June 1 closing data, more of our partners (62%) remained down in year-over-year net deposits, though many made great strides in the race up to June 1.
In a reversal since May 1, schools with June 1 deadlines out-performed their May 1 peers with respect to year-over-year net deposits, though on average, schools from both deadlines are down low single digits year-over-year.
Our early read is that schools moving their deadline to June 1 were not disadvantaged. If there was a downside compared to their May 1 peers, it was that June 1 schools lacked earlier visibility into how their classes were forming, and it took longer for their classes to settle.
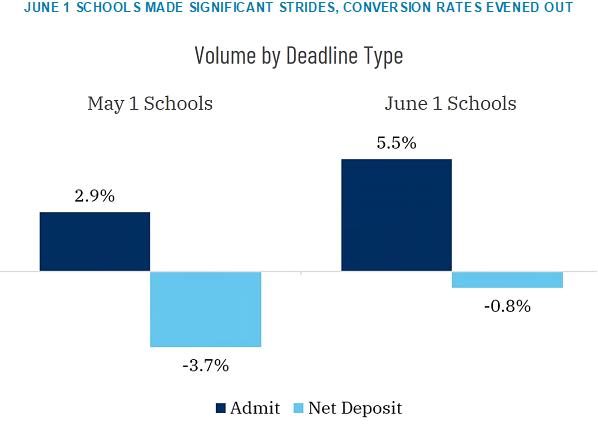
While net deposit progress was evident for schools of each deadline, June 1 schools made up significantly more ground throughout the month of May.
Overall, net deposits for May 1 schools are down 3.7% in year-over-year volume, with the average being driven by a range across partners of down 17.1% to up 7.5%. Meanwhile, net deposit volume from June 1 schools are down 0.8% year-over-year, with their net deposit average coming from a range across partners of down 23.3% to up 12.4%.
One thing for us to keep a collective eye on with the June 1 net deposit gains is melt, particularly throughout the month of June. The May 1 school tallies as of June 2 include a full month of melt, but they also have a month lead on management and prevention. June 1 schools’ melt volume was significantly down, and these schools will need to shift quickly into net deposit engagement and preservation mode if they want to maintain their position.
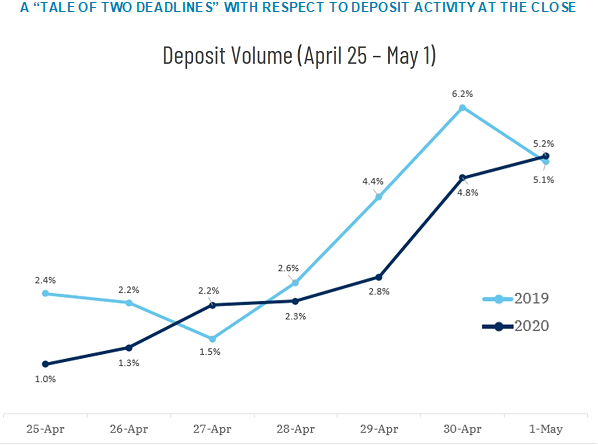
This chart from May 2 plots daily net deposit volume as a percent of total net deposits in the week leading up to the May 1 deadline. As of May 2, 20% of the total deposit volume this year came in the week leading up to May 1, with 9.9% of all deposit activity coming on April 30 and May 1 alone.
Now let’s look at a similar view for the week leading up to June 1 but break it down in terms of net deposit volume by day for each deadline type as a percent of their total net deposits.
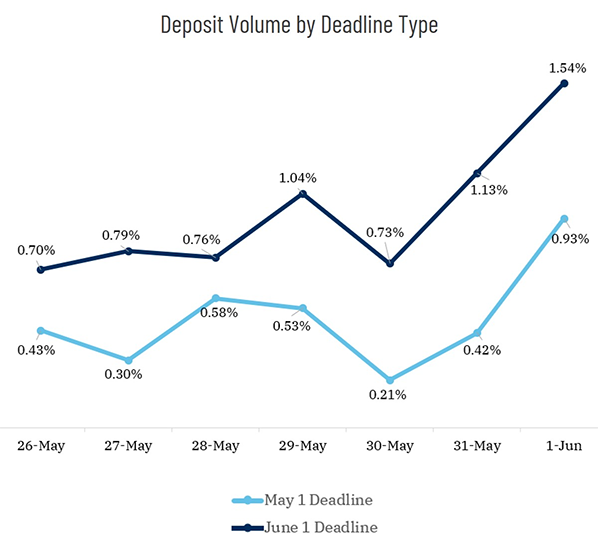
By contrast, total deposit activity was only half as active (10.1%) as the week leading up to May 1. Schools of either deadline saw daily gains, but June 1 schools outperformed May 1 schools on each of the seven days leading up to the final deadline.
Ongoing Analyses
While the major deadlines have passed and classes are more fully formed, opportunity remains. We still see life left in the pools of those partners with gaps to close or shape needed, and we continue to work with partners to leverage MARKETview data to prioritize undecided students and families that fit their mission and complete their class.
Learn More
To learn more about how partners are leveraging MARKETview, contact us.
About MARKETview
MARKETview is a partnership that combines an analytics platform of student record-level data that is standardized, enriched, and contextualized to enable informed strategic decision-making, investment, and resourcing priorities in real-time. It allows higher ed leaders to understand performance in an evolving marketplace and is supported by dedicated advisory expertise to turn insights into action.
Currently MARKETview data extends from the first inquiry of a student through to first year of retention. Eventually the platform and analysis will extend to include student engagement and fundraising data for complete vision into a student’s progress across the lifecycle.
With Thanks to AGB Sponsor: Farrell Day
![]()
Peter Farrell
Founding Principal, Farrell Day
[email protected]