 Chat with AGB Board Bot
For generations of Americans, a college degree has been a singularly effective pathway to the middle class. Yet today, even as recent studies confirm the value of a degree, higher education institutions face growing skepticism from all quarters. Timeworn tropes about the self-actualization and honed powers of critical thinking students achieve through a degree or about the formative nature of the college experience, however accurate, seem to have lost their prior persuasiveness. Similarly, the public seems less willing than in the past to accept selectivity, faculty publications, or research advances as barometers of educational quality. Instead, both lawmakers and families demand a dollars-and-cents accounting of student outcomes—not just whether students cross the stage but also how they fare in their careers thereafter.
For university leaders and trustees, this newfound scrutiny is often as uncomfortable as it feels unwarranted. Yet, in this moment of skepticism also lies an opportunity. By measuring post-completion success, institutions can build a powerful evidence base for the degree’s positive impacts, facilitate data-driven conversations with concerned stakeholders, and justify line items in state appropriations. The information can also help administrators to understand where and how various programs are best delivering returns on investment (ROI) for students over the long-term, and identify the targeted actions needed to ensure that all students are able to reach their full potential. While faculty may bristle at reducing the value of an education to a monetary figure, the right basket of measures, including not only earnings but also graduate underemployment and economic mobility, can offer a more holistic perspective on how well schools are serving their students.
Stakeholders Increasingly Question the Value of a Bachelor’s Degree
In 1960, only eight percent of Americans had graduated from college, and the price tag was only a third of what it is today, controlling for inflation.1 Getting a degree was widely perceived as a golden ticket—accessible to all and a seeming guarantee of career success, but also a relative rarity. No one asked questions because the value was obvious. Fast forward sixty years to today and going to college has become a basic expectation as the share of Americans with at least a bachelor’s degree has risen nearly fivefold.
However, the growth in college-level jobs has not kept pace with rising levels of educational attainment, causing many graduates to flounder. In fact, a recent study by the Burning Glass Institute,2 a non-profit research center focused on the intersection of learning and work, and the Strada Education Foundation indicates that more than half of graduates are working in a job they could have landed without a degree. Meanwhile, 38 percent of those who enroll in college fail to finish within six years, according to the National Center for Education Statistics.3 Taken together, this means that only around a third of students who start college make it to a career that warrants, and in turn compensates them for, their degree. The remaining two-thirds end up earning little more than their peers with just a high school diploma. In that context, the current skepticism about the value of college seems more understandable. Understandable, perhaps, but also overly simplified. It’s not that a degree fails to offer a return on investment. The return is very real and demonstrable. Rather, the problem is that the returns are accrued by too few.
As a result, a growing number of adults express a lack of confidence in higher education,4 and both four-year and community college enrollments have declined considerably. Employers are showing signs of uncertainty, too. The number of job ads that previously specified a college degree but that have since removed the requirement has increased by 400 percent since 2014, according to a recent study by the Burning Glass Institute and Harvard Business School.5 And a similar trend is emerging in the public sector. Maryland, Pennsylvania, and Utah no longer require four-year degrees for most jobs in state government, and the Biden administration is urging federal agencies to consider following suit. While this growing movement to strip back degree requirements–a practice often referred to as skills-based hiring–is largely a response to talent shortages and equity concerns, such moves signal a meaningful change in the value that employers place on a college degree.
State legislators are also raising questions. Presently, at least fifteen states have passed or proposed laws that require colleges, universities, and systems to collect and make publicly available such data as information on student loan payments and the sorts of jobs students obtain upon graduation.6 Some states are going further: Colorado, Texas, Kansas, and North Carolina, among others, have all introduced initiatives to compute the ROI of bachelor’s degrees to students, typically at the school and program level, with similar mandates under consideration by the U.S. Department of Education.7
Add to this moment the increasing competition from microcredential and industry-based certification programs, along with those of national online university behemoths, and the message is clear: Institutions of higher education can no longer rely on vague assurances about a bright future to enroll students. Instead, colleges and universities must offer a public accounting of the concrete benefits of bachelor’s degrees to the students and governments that choose to invest in them. The most powerful way to showcase those benefits is by calculating and discussing with stakeholders the ROI of today’s bachelor’s degree.
Measuring the Returns on a Degree
There is a great deal that is already known about the value of today’s bachelor’s degree, including the fact that it remains a solid investment. According to a 2019 Federal Reserve Bank study, college graduates earn on average about $33,000 more per year than their counterparts without a degree or $1.3 million in additional earnings over a career.8
That said, we also know that while some degree holders earn much more, many make much less. Researchers at the Georgetown Center on Education and the Workforce have found that 28 percent of associate’s degree holders and even 16 percent of those with only a high school diploma earn more than the median four-year college graduate.9 Further, we know that student outcomes vary significantly by institutional selectivity, field of study, race/ethnicity, gender, and by the share of an institution’s students who are eligible for Pell grants, among other factors. These dispersions underscore the importance of measuring long-term career success, and of doing so not only at an institutional level but also for each individual degree program and for a broad range of student communities. It is by capturing that level of nuance that we can highlight opportunities for improvement and targeted action.
But which student outcomes should we measure? It is a valid critique that conventional economic measures cannot capture non-economic benefits, such as increased civic engagement, sense of purpose and fulfillment, health outcomes, or artistic or intellectual accomplishment. These are essential to students and their communities, key to institutions’ fulfilling their public purposes, and worthy of further study. Nevertheless, there is good reason to measure the bachelor’s ROI, even if in doing so we fall short of a full picture. Given the very high cost of attending college, and the fact that the average loan balance at graduation for a 2023 graduate was $37,650,10 colleges and universities cannot, in good conscience, ask students to make the investment without some level of certainty that the degree-holder will be able at minimum to manage the debt or, more ambitiously, achieve financial security and economic mobility.
With that in mind, we will assume as a matter of principle that gauging career success is an important measure of accountability for any institution’s commitment to students. In this article, I will consider the advantages and limitations of three economic measures–underemployment, economic mobility, and financial ROI itself–and describe how they can be used in concert to render a meaningful assessment of student performance beyond the academy.
Measuring ROI through Lifetime Earnings
Earnings can vary significantly by institution and field of study. Consequently, so can a degree’s ROI. Consider, for example, the experience of the University of North Carolina System, which was directed in 2021 by the University of North Carolina Board of Governors to calculate the respective ROI for each of the 765 undergraduate programs offered across its 16 institutions.11
The UNC System defined ROI as a student’s lifetime earnings minus the costs of college relative to what someone would have earned if he or she hadn’t gone to college. The topline finding is reassuring. The median student who graduates with a bachelor’s degree in any field of study from any of the UNC System institutions has lifetime earnings about $572,544 greater than a comparison group of individuals who did not attend college or attended some college but did not complete a degree, and $303,966 greater than those who enrolled in the UNC System but did not complete a degree. (Arguably, this latter population of students is a better proxy for what graduates would have earned if they didn’t go to college because it more closely controls for selection biases.)
Additionally, while the vast majority (94 percent) of undergraduate programs had a positive ROI, about 17 percent had a median lifetime ROI greater than $1 million. While encouraging, this is unsurprising given the longstanding and robust research that demonstrates the wage premiums associated with bachelor’s degrees. Also, perhaps unsurprisingly, many of the undergraduate programs with the highest ROI are those that are traditionally in demand and offer high wages. For example, “biotechnology” tied for first place for highest median lifetime earnings at $3,234,0101, with “science technologies/technicians,” coming in second at $2,245,912.
More revealing is the significant spread in earnings, even within the same campus. Earnings across UNC-Asheville, for example, varied sixfold across departments, highlighting how important it is for institutional leadership to unpack overall performance measures program by program (and for colleges to advise students about career earnings potential when choosing a program of study). With such a wide dispersion in outcomes across programs, it is easy to see how blind spots might obscure review and oversight, whether by the provost’s office or the university’s trustees.
Figure 1: Career Earnings Spreads by Program of Study
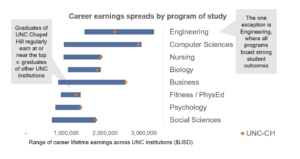
Source: Burning Glass Institute analysis
Interestingly, the analysis revealed specific strengths at each institution. Nearly every university in the UNC System has at least one department whose students earn more than the systemwide average–and all, including the most selective, had departments that were delivering less consistently for students as well. For example, while students with a bachelor’s degree from UNC-Chapel Hill in liberal arts earn 173 percent of what their counterparts from other campuses in the UNC System earn, those with a bachelor’s degree from the flagship campus’s engineering program earn scarcely more than the median earnings of their counterparts from other UNC System campuses. These are important insights, not only for campus-level opportunities to capitalize on unique campus strengths, but also for broader system-level decisions to optimize program portfolios. Such information can also inform applicants, as they compete for limited seats in programs or consider trade-offs on where to enroll.
In general, the impact of institutional quality emerges most strongly for programs associated with higher earnings overall. For example, in the UNC System, the “engineering and computer science” programs have both the highest average earnings and also the widest spread of earnings across colleges. Among computer science programs, for example, we observe median lifetime earnings peaking at $2.9 million at UNC Chapel Hill and falling to $1.2 million at North Carolina Central University and $1.3 million at UNC Asheville. Conversely, graduates with degrees in “homeland security,” “English literature,” and “family sciences” have the lowest earnings’ spread and are also in the bottom half of programs by average lifetime earnings. This tells us that it is not enough just to offer programs in high-income fields. Rather, even with the benefit of a tail wind, student success depends heavily on how well a subject is taught.
Until recently, the exercise of measuring a degree holder’s earnings would have been nearly impossible. Administrators would have had to depend on massive alumni surveys, with their notoriously low response rates (which fall even further over the years beyond graduation), biased samples, and widespread inaccuracies. Today, however, new datasets make it feasible for institutions to study graduates’ earnings to glean meaningful insights—and new federal regulations will require the U.S. Department of Education to calculate and make available wage premium data at the program level for colleges receiving Title IV funds. (Editor’s note: see the “Legal Standpoint” column in this issue of Trusteeship.)
Some states, like North Carolina, can use longitudinal data systems that aggregate tax records to track graduates’ income over time. While these systems yield the most accurate picture of a graduate’s earnings, they also come with limitations. Specifically, they don’t offer a basis for tracking the incomes of those who move out of state, and they provide no insight into the specific occupational trajectories that characterize a career. That is, are a graduate’s low earnings due to dim career prospects, an accomplished career in a low-paying field, or life circumstances such as family care that limit their availability for full- or part-time work? Still, these sorts of longitudinal data systems are a useful resource for campuses that can access them.
Alternatively, some institutions are now relying on analysis of massive career-history datasets to collect information that can be used as a proxy of graduates’ earnings. That’s important because many states have yet to invest in robust longitudinal data systems and many campuses–private ones in particular–are unable to access tax records. Drawn from profiles found on sites like LinkedIn and online resumes, these databases offer comprehensive insights into graduates’ career progression and can be connected to compensation data to infer likely wages for a given role and company. For example, the database which researchers at the Burning Glass Institute have compiled to facilitate our study of college outcomes includes career histories of 65 million US workers, representing two-thirds of the nation’s college-educated workforce. Using a combination of this sort of data and state longitudinal data, the UNC System was able to isolate student outcomes by institution, degree level, program of study, and socioeconomic background, and to calculate the ROI both to the student and to the state.
Underemployment as a Broader Measure of ROI
As revealing as lifetime earnings are as a measure, the underlying premise that the value of a college education can be measured in the size of a paycheck is sure to make faculty bristle–and rightly so. Ultimately, the best degree is the one put to best use: applied to meaningful work that leverages fully an individual’s skills and abilities. There is no shortage of careers that are both deeply rewarding and low paying. Graduates in one of those fields have received no less of a return on their investment than their classmate in computer science–and yet earnings-based measures register such an outcome as a failure.
A measure of graduate underemployment–that is, the prevalence of graduates working in jobs that don’t require a degree–is a helpful complement to ROI because it skirts these flash points. Whether graduates are working as social workers or investment bankers, they are putting their degree to good use either way, regardless of income. But it would be a tenuous argument indeed to say that graduates working as the proverbial baristas have realized the full value of their education. Underemployment clarifies what is at play by avoiding financial measures altogether and focusing instead on the fundamental question of whether degree-holders’ jobs utilize their education and skills.
Seeing graduates make it to college-level jobs is a minimum standard so it would be tempting to assume that such a measure of career success would represent a low bar for most institutions and most programs. Unfortunately, underemployment is stunningly pervasive. New research from the Burning Glass Institute and the Strada Education Foundation shows that, nationwide, more than half of graduates are underemployed a year after earning their bachelors’ degrees.12 While underemployment varies widely by program of study, as well as by institution type and selectivity, no program is immune. Even institutions deemed “more selective” under the Carnegie Classification see 39 percent of their students underemployed five years after graduation, including 20 percent of their engineering graduates, as compared to 49 percent of students at “inclusive” (typically open enrollment) institutions overall and 33 percent of their engineering majors.
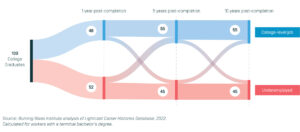
Those of a certain age might remember being advised not to worry too much about what job they took because it would all work out just fine over time. If that was true then, it is certainly not true today. Once underemployed, a worker is likely to remain underemployed throughout his or her career, according to the Burning Glass-Strada study. Even a decade after graduation, three-quarters of those initially underemployed are still working in jobs that don’t require their degree. The surprising stickiness of underemployment reinforces the importance of this yardstick, especially when considering that an underemployed worker loses an average of $25,000 per year in earnings. Underemployment is too big a problem for institutions and their stewards to ignore.
Figure 2: Employment Outcomes By Years After Graduation
Here, too, an analysis of underemployment can reveal wide disparities even within the same institution. Health majors who, on average, have the lowest risk of finding themselves underemployed because of their direct pathway to a job and the clarity of licensing standards, have only one-third the rate of underemployment of criminal justice majors, who face the longest odds of finding college-level employment. (Still, with one in four health graduates underemployed, the risk they face is far higher than one might expect for the “safest” major there is.) The same can also be true even within a given department. Among business programs, there is a threefold difference between the underemployment of accounting majors (24 percent) and hospitality management majors (70 percent). All of this shows that subjecting each program to an assessment of graduates’ underemployment can be an important diagnostic tool.
As with long-term earnings, tracking levels of underemployment for each institution and program of study would have been impossible in the past. Today, the same datasets that make it feasible to follow the career histories of graduates at scale also enable the measurement of underemployment, both initially and over time. By analyzing the nature of the roles alumni are working in, researchers can readily determine who is employed to their full potential and who has been left behind. On an individual program level, low rates of underemployment signal a high level of alignment between the skills taught on campus and those sought by the employers most relevant to students. That said, it is important to note that underemployment is also influenced by factors outside of an institution’s control, such as geography. A major in video game design may face different prospects in Tulsa versus Los Angeles. Identifying these factors is important both for making a full accounting of program-level underemployment and determining possible changes to better align offerings with opportunities, such as enhancing programs with work-based learning opportunities with employers both locally or elsewhere or rethinking program viability altogether.
How Far a Degree Takes You: Economic Mobility as a Measure of Return
If college is a bridge to opportunity, then we have to examine not only where the student’s path ends, but also where it began. ROI, even when compared to a rigorous counterfactual, such as earnings of an institution’s non-completers, is an absolute measure. But the distance a graduate travels is relative to his or her origin and varies widely. This is particularly true for first-generation college graduates, students of color, and those from economically vulnerable households, for whom the investment may be especially large, both in isolation and as a share of household income.
College offers an entirely different level of return for students from low-income households than for those with higher incomes. For poor students, the cost of college represents a much greater share of household income, but also a lifechanging level of socioeconomic mobility, at least for those who manage to avoid underemployment. Conversely, an elite university’s alumni may be earning enviable incomes but that may say less about the university’s program if most students hail from upper socioeconomic ranks. To borrow from football coaching legend Barry Spitzer, how do we distinguish between hitting a triple and being born on third base? The answer, in this case, is by considering returns based on a student’s starting point. By applying the lens of economic mobility, we can layer in the context necessary to assess the magnitude of the degree’s impact.
Yet again, in this instance, the UNC System’s findings are instructive. Using as a starting point parents’ household income, the UNC System concluded that, regardless of socioeconomic background, the vast majority of students will move up at least one income band over a 20-year period as a result of having earned a UNC System degree. However, for students from economically vulnerable households, the gains are much greater. Among students with a household annual income of less than $17,800 at the time of enrollment, 65 percent rose at least three income bands over twenty years to secure an income of more than $51,800, including 42 percent who rose a whopping four income bands, with annual incomes of at least $91,300.
Economic mobility plays out differently for different majors, and sometimes in unexpected ways. The usual suspects–typically STEM disciplines–top the list in unlocking the greatest levels of economic mobility for graduates. However, in the UNC System, a degree in area & ethnic studies advances students at comparable rates to one in business or various natural sciences, with 44 percent of these graduates moving up four income bands. In fact, some low-earning majors, such as “homeland security” and “parks & recreation” offer very high rates of upward mobility, as the benefits of the degree overwhelm the relatively poor earnings profile of the majors themselves.
When combined with an analysis of graduates’ earnings, colleges already have the data they need to analyze economic mobility squarely within their records. The earnings analysis tells us where students wind up. Financial aid records and validations of Pell eligibility provide a clear indication of where students started. Taken together, these yield an insightful measure of the distance that programs are enabling graduates to travel.
ROI and the Equity Imperative
For many institutions, the June 2023 Supreme Court ruling on admissions practices raised serious questions about their ability to continue to fulfill commitments to racial equity. To date, most of the work to level the playing field of higher education for Black, Hispanic, and Native American students has focused on access. By measures of diversity, American higher education has come a long way, with bachelor’s conferrals nearly mirroring the nation’s demographic makeup (28 percent of conferrals in 2021 were to Black, Hispanic, and Native American graduates13 versus those groups’ 32 percent proportion of the US workforce14). While this is meaningful progress, it’s not enough. The work to achieve educational equity doesn’t end once these students step into the classroom. What gets measured gets managed and what hasn’t been getting measured is graduates’ career outcomes. By this standard, we have a lot more work to do.
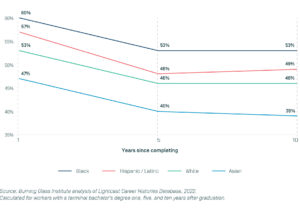
When it comes to outcomes, yawning disparities by race and ethnicity persist, with little recent progress. A recent Economic Policy Institute analysis of Current Population Survey data shows that Black workers with a bachelor’s degree make 81 cents on the dollar relative to their white classmates.15 In fact, white workers with a high school diploma and no college are better paid than Black workers with an associate’s degree, earning $19 and $18 per hour, respectively, according to the National Fund for Workforce Solutions.16 Further, Black and Hispanic degree-holders experience disproportionately high rates of underemployment, even when their degrees are in a high-demand field. Nationwide, among members of the class of 2012, 60 percent of Black graduates and 57 percent of Hispanic graduates were underemployed after graduation, as compared to 53 percent and 46 percent of white and Asian graduates, respectively, according to the Burning Glass-Strada report.
Figure 3: Underemployment Rates by Race, Ethnicity, and Education
Against this backdrop, the next frontier in the drive for greater educational equity must be career outcomes. Colleges and universities must lead that charge by tracking student outcomes by race and ethnicity. By doing so, institutions can determine whether the bachelor’s degree is delivering as well for Black and Hispanic students as for their majority peers.
Of course, colleges and universities cannot address the societal problems underlying these concerning disparities singlehandedly. But within their spheres of influence, institutions can examine the three career outcome measures (ROI, underemployment, and economic mobility) through the lens of race and ethnicity to inform institutional decisions regarding how best to support and prepare students of color to realize their full potential and to ensure that each dollar spent by a student of color produces a return equal to that of their majority peers.
What Works in Boosting ROI
Educators traffic in assessment both formative and summative. Measuring ROI may seem decidedly summative–akin to the final exam grades that get reported to the registrar–but it is not. Beyond being responsive to growing pressure for accountability and beyond developing an evidence base for articulating the value of an institution’s degrees, these metrics can yield critical insights to guide efforts aimed at improving student outcomes.
Five Levers to Boost ROI:
1. Build high-value skills into the curriculum.
It should come as no surprise to a university that what you teach matters. Yet most universities offer scant guidance to faculty as to which skills will give their students an edge with employers. Nor do they usually provide students with guidance regarding which skills they should acquire in order to achieve their career goals—or how to describe to employers what they have learned. That’s a squandered opportunity. Burning Glass Institute research finds that in any program of study there are specific skills that increase graduates’ earnings.17 In some cases, a single skill can net students $10,000 per year or more in additional wages and unlock thousands of incremental opportunities. For example, a public administration major with investment skills can secure a salary that is up to 30 percent greater than a comparable applicant lacking investment skills, while strategic-planning skills can increase earnings for liberal arts graduates by 20 percent.
Importantly, it isn’t just applied or technical skills that make a difference. Some of the skills that offer the greatest premiums are foundational, such as strong writing and collaboration skills. Yet this sort of data is rarely gathered by institutions, much less shared with their students. Students need to know which skills are most likely to move the needle in their careers and where to build them, whether within departmental offerings, through other course offerings, or outside the classroom. That kind of awareness requires beefing up advising resources and integrating academic and career counseling so that students can make informed decisions about how to fill their course dance cards. Some might worry that such an approach could lead students to forego less applied courses but, far from sacrificing the liberal arts, signposting skill development opportunities can offer needed scaffolding, enabling interested students to pursue their passion while still building a high-value portfolio of skills. The classics department isn’t about to start teaching marketing skills, and shouldn’t. But it absolutely should make sure that students who are pursuing a classics degree while considering marketing careers know where they can acquire relevant marketing skills on the side.
Faculty need better information as well, so that they can both build relevant skills into the curriculum and also articulate in business language the marketable skills they are already teaching. When administrators at the University of Central Florida started offering their department staffs feedback on the skills they had identified as most relevant to a program’s graduates, the gender studies faculty found that the rigorous preparation they were providing students to ready them for field work was giving them highly sought-after project management skills. That enabled the department both to make a more effective pitch to prospective students and to help graduates articulate what they had learned in business terms. Importantly, the labor market can change rapidly. To ensure continued alignment, colleges should implement a more frequent cadence of program reviews and leverage increasingly powerful labor market data sources to ensure that the skills taught in the classrooms mirror those sought by industry.
2. Align program offerings with opportunity.
Alignment isn’t needed just at the curricular level. Rather, program portfolios must align with employer needs. Wide disparities in outcomes across programs should raise serious questions about the program portfolio, and indicate where difficult decisions may be warranted. Particularly for smaller institutions, it simply isn’t possible to deliver excellent outcomes across 50 or more programs. Understanding departmental strengths not only in terms of enrollments or institutional history but also with regard to programs that outperform peers on outcomes can help university leaders and trustees determine where to focus limited resources. In undertaking these evaluations, it is important to remember that all jobs are local. The data-science degree that may unlock considerable opportunity in New York or San Francisco may be of less relevance at a regional public university situated in a rural community.
3. Ensure that all students have opportunities for work-based learning.
Co-ops, internships, and other forms of work-based learning play a big role in setting up students to succeed. According to the National Association of Colleges and Employers,18 students with a paid internship received over 50 percent more job offers and had starting salaries around $22,000 higher than other classmates. Further, the Burning Glass Institute’s report with Strada Education Network shows that those who have had at least one internship are 49 percent less likely to wind up underemployed, with similar benefits across degree fields. And these differences persist over time. Forthcoming Burning Glass Institute research shows that students at institutions with near-universal work-based learning participation outperform on long-term earnings when compared to peer institutions, even when controlling for selectivity, ACT scores, and student demographics. In other words, campuses that create opportunities for students to engage in work-based learning tend to “punch above their weight,” when it comes to student placements and earnings after graduation. Yet only 29 percent of students today have a paid internship, and Black and Hispanic students are even less likely to secure one, even as they benefit the most from the experience.19 For example, Black computer science majors with an internship are 30 percent more likely to land a professional-level job.20 Campuses that care about student outcomes need to ensure that work-based learning is deeply integrated into every program, not just traditional strongholds like engineering and business. These, too, are metrics that matter for boards.
4. For community colleges, bring new focus to applied degrees and non-degree workforce programs.
Despite having shed the label of “junior colleges” decades ago, many community colleges continue to model themselves on four-year universities and continue to concentrate on minting transfer degrees accordingly. On the one hand, this is understandable; 80 percent of community college enrollees report that they intend to complete a bachelor’s degree.21 Yet, according to U.S. Department of Education analysis, only 13 percent of community college transfers with associate’s degrees manage to complete a bachelor’s within eight years. That means that, for most community college graduates, their associate’s is a terminal degree–and one with a wage premium of only 5 percent when compared to a high school diploma. Meanwhile, a wide range of non-degree workforce training programs, as well as some associate in science degrees, yield significant income gains. Community colleges certainly should continue working to improve rates of bachelor’s completion for transferring students through clear pathway and articulation agreements and through close collaboration with four-year institutions, to align courses and ensure adequate levels of preparation. Yet, just as importantly, community college boards should also rethink their fixation on transfer degrees and double down on the programs that already work.
5. Provide students with longer-term support.
In only the past five years, 37 percent of the skills associated with the average US job have been replaced by new skills, according to a recent report by the Burning Glass Institute and the Boston Consulting Group.23 In such a dynamic market, traditional once-and-done education models no longer work. Instead, everyone needs to be able to acquire new skills on the fly, whether to advance in careers or just remain relevant. For colleges to ensure that their graduates continue improving their skills over time, they should consider providing longer-term support. That starts with providing lifetime access to university resources like the career services office. But it also includes extending programming to offer graduates opportunities to upskill as their careers evolve. By doing so, campuses not only boost student outcomes over the long-term and bolster their relationships with alumni, but also create new markets and draw in new learners even as traditional enrollments decline. Ensuring that graduates have multiple and consistent opportunities to acquire new skills will help to ensure their long-term success in the workforce.
Educators put students first everyday but somehow feel that measuring outcomes for graduates is antithetical to the foundational tenets of the academy. Yet, in study after study, students report that they see a college education as the key to unlocking a great career. Seen from that light, putting students first means putting graduates’ opportunities first. When the price of college continues to rise even as long-term wage growth largely stagnates,24 opting to disregard the economics of the bachelor’s degree is a luxury most Americans can’t afford.
Nor should colleges and their stewards. The data on student outcomes can tell powerful stories of student empowerment, of breaks in intergenerational poverty, and of realized dreams. In the economic data on outcomes is the proof that the sacrifices more and more families are having to make to send their kids to college can garner meaningful payoffs and that there are lucrative opportunities available on the other side of the bachelor’s degree. The data also offer important insights on how to make the returns to an investment in higher education more consistent and more certain. In our silence, however, other voices–many increasingly hostile to higher education–are filling the void. While we may pretend it isn’t true, money does talk. In the case of college, it can have a great story to tell.
Matt Sigelman is president of the Burning Glass Institute, a non-profit research center and experimentation laboratory focused on the intersection of learning and work. He is also senior advisor at the Harvard Project on the Workforce.
Endnotes
1. Statista. “Educational Attainment in the U.S. 1960–2022 | Statista,” October 6, 2023. https://www.statista.com/statistics/184260/educational-attainment-in-the-us/.
2. Burning Glass Institute and Strada Institute for the Future of Work, Talent Disrupted: Underemployment, College Graduates, and the Way Forward (Burning Glass Institute and Strada Institute for the Future of Work, 2024), https://www.burningglassinstitute.org/research/underemployment.
3. National Center for Education Statistics, U.S. Department of Education, Institute of Education Sciences, “Undergraduate Retention and Graduation Rates,” Condition of Education 2022, https://nces.ed.gov/programs/coe/indicator/ctr.
4. Megan Brenan, “Americans’ Confidence in Higher Education Down Sharply,” Gallup Education, July 11, 2023, https://news.gallup.com/poll/508352/americans-confidence-higher-education-down-sharply.aspx.
5. Matt Sigelman, Joseph Fuller, Alex Martin, Skills-Based Hiring: The Long Road from Pronouncements to Practice (Burning Glass Institute, February 2024), https://www.burningglassinstitute.org/research/skills-based-hiring-2024.
6. Lilian Burke, “States step in to provide information about the return for students on a college education,” The Hechinger Report, January 21, 2023, https://hechingerreport.org/states-step-in-to-provide-information-about-the-return-for-students-on-a-college-education/.
7. Department of Education, “Financial Value Transparency and Gainful Employment,” Federal Register 88 no. 194 (October 10, 2023), 70004–70193, https://www.federalregister.gov/documents/2023/10/10/2023–20385/financial-value-transparency-and-gainful-employment.
8. Jaison R. Abel and Richard Dietz, “Despite Rising Costs, College Is Still a Good Investment,” Liberty Street Economics (blog), June 5, 2019, https://libertystreeteconomics.newyorkfed.org/2019/06/despite-rising-costs-college-is-still-a-good-investment/.
9. Anthony P. Carnevale, Bah Cheah, and Emma Wenzinger, The College Payoff: More Education Doesn’t Always Mean More Earnings (Georgetown University Center on Education and the Workforce, 2021), https://cew.georgetown.edu/wp-content/uploads/cew-college_payoff_2021-fr.pdf.
10. Melanie Hanson, “Average Student Loan Debt by Year,” EducationData.org (October 25, 2023), https://educationdata.org/average-student-loan-debt-by-year.
11. “UNC ROI Study of University Programs,” The University of North Carolina System, accessed February 12, 2024, https://myinsight.northcarolina.edu/t/Public/views/UNCLandingPage/LandingPage?%3Aembed=y&%3AisGuestRedirectFromVizportal=y.
13. National Center for Education Statistics, U.S. Department of Education, Institute for Education Sciences, “Fast Facts: Degrees Conferred by Race/Ethnicity and Sex,” accessed February 12, 2024, https://nces.ed.gov/fastfacts/display.asp?id=72.
14. U.S. Bureau of Labor Statistics, “Employment and Earnings by Race and Ethnicity, 2021,” BLS Reports (January 2023, Report 1100), https://www.bls.gov/opub/reports/race-and-ethnicity/2021/home.htm.
15. Elise Gould, “8 Years of the Lilly Ledbetter Fair Pay Act,” Economic Policy Institute Working Economics Blog, January 27, 2017, https://www.epi.org/blog/8-years-of-the-lilly-ledbetter-fair-pay-act/.
16. Abbie Langston, Juston Scoggins, and Matthew Walsh, Race and the Work of the Future: Advancing Workforce Equity in the United States (National Fund for Workforce Solutions, November 12, 2020), https://nationalfund.org/our-resources/publications/race-and-the-work-of-the-future.
17. Matt Sigelman, Jeff Selingo, Vivek Sampathkumar, and Luke Chen, Making the Bachelor’s Degree More Valuable: Why the Degree Still Works, Where It Doesn’t, and How To Redesign the B.A. To Be Worth More in a Degree-Optional World (The Burning Glass Institute, March 2023), https://www.burningglassinstitute.org/research/making-the-bachelors-degree-more-valuable.
18. Mary Gatta, “The Class of 2023: Inequity Continues to Underpin Internship Participation and Pay Status” (National Association of Colleges and Employers, August 8, 2023), https://www.naceweb.org/diversity-equity-and-inclusion/individuals-with-disabilities/ready-willing-but-still-underemployed/6415e45a-e573–4a59–85c4–8cb28aa4a5d4.
19. Nichole Torpey-Saboe, Elaine W. Leigh, and Dave Clayton, The Power of Work-Based Learning (Strada Education Network, 2022), https://stradaeducation.org/wp-content/uploads/2022/03/031522-PV-report.pdf.
20. Matt Sigelman and Christopher B. Howard, Dynamos for Diversity: How Higher Education Can Build a More Equitable Society (Workday and The Burning Glass Institute, 2021), https://forms.workday.com/content/dam/web/en-us/documents/whitepapers/Dynamos%20for%20Diversity.FINAL.pdf.
21. Center for Community College Student Engagement, National Report 2023: Helping Community College Students Climb the Transfer Ladder (Center for Community College Student Engagement, 2023), https://cccse.org/NR2023.
22. Nathan Sotherland, Kevin Stange, and Jordan Matsudaira, “New Measures of Postsecondary Education Transfer Performance: Transfer-Out Rates for Community Colleges, Transfer Student Graduation Rates at Four-Year Colleges, and the Institutional Dyads Contributing to Transfer Student Success,” Homeroom: The Official Blog of the U.S. Department of Education, November 9, 2023, https://blog.ed.gov/2023/11/new-measures-of-postsecondary-education-transfer-performance-transfer-out-rates-for-community-colleges-transfer-student-graduation-rates-at-four-year-colleges-and-the-institutional-dyads-contributi/#_edn8.
23. Matt Sigelman, Bledi Taska, Layla O’Kane, Julia Nitschke, Rainer Strack, Jens Baier, Frank Breitling, and Ádám Kotsis, Shifting Skills, Moving Targets, and Remaking the Workforce (Burning Glass Institute, May 2022), https://www.burningglassinstitute.org/research/shifting-skills-moving-targets-and-remaking-the-workforce.
24. Drew DeSilver, “For Most U.S. Workers, Real Wages Have Barely Budged for Decades,” August 7, 2018, Pew Research Center, https://www.pewresearch.org/short-reads/2018/08/07/for-most-us-workers-real-wages-have-barely-budged-for-decades/.
RELATED RESOURCES

Reports and Statements
Return on Investment in College Education

Trusteeship Magazine Article
Design for Affordability
Reports and Statements
Top Public Policy Issues Facing Governing Boards in 2023–2024:
Affordability and Value